IntMath Newsletter - Math tools for school, world population
By Murray Bourne, 25 Aug 2009
In this Newsletter:
1. Math tip (a) – Top math tools for school
2. Math tip (b) – Current world population; exponential growth
3. Latest IntMath Poll
4. From the Math Blog
5. Final thought – Keep it simple!
Each time I send out a mail there are a number of addresses that bounce back as "unknown address". Please add the IntMath Newsletter to your email "whitelist", so you don't miss an issue!
1. Math tip (a) – Top math tools for school
School is starting after a long summer break. Here are some tools and resources that you may find useful during the year.
a. Wolfram|Alpha
Cost: Free
Wolfram|Alpha is a "computational knowledge engine" that gives you a wealth of information about your math search. See my overview: Wolfram's Alpha
b. GraphSketch
Cost: Free
See my review at: GraphSketch.com free online math grapher
c. Algebra Problem Solver
Cost: You get the final answer free
You need to pay a subscription to see the explanation steps. Solves over 1 million problems a month for students.
d. Free math software downloads
Cost: As it says, "free"
This is a popular list.
e. DVD Math Videos
Cost: Moderate
Easy to understand explanations. Relaxed video lessons that explain a wide range of math topics. An 8-hour video course costs less than $30. If you order one of the bundled sets, it works out to $3.50 per hour.
f. Calculus Made Easy
Cost: Free
PDF version of an excellent explanation of calculus
g. Real-life math examples
Cost: Free
I get a lot of requests for real-life math examples, from students and teachers alike.
- Math Illuminated (See my overview of Math Illuminated.)
- Whos Counting John Allen Paulos examines the news through numbers (See my overview of Who's Counting)
- Twenty Global Problems and Twenty Years to Solve Them
- Earth killer - composite trigonometry CO2 graph
h. Free math books
Cost: As it says, "free"
Large list of free math books in PDF form
i. Interactive Mathematics
Cost: Free
Last but not least, hundreds of lessons in a wide range of topics from number and algebra through logarithms and trigonometry through to college-level calculus.
I hope you found something useful in that list!
2. Math tip (b) – Current world population, an example of exponential growth
On the home page of Interactive Mathematics I've got a "current world population" counter.
A reader was intrigued with this and asked if my counter was somehow linked to some global population database.
Well, no.
I have a script running in the background and it uses a best estimate for the population at a particular point in time (currently just under 6.8 billion) and applies the current estimated rate of growth (1.3% per year). So the population at time t (in years) is given by:
P(t) = 6,780,000,000 × (1.013)t
This, of course, gives the net population (number of new babies minus the number of deaths).
This formula is an example of an exponential growth equation. See more at Exponential and Logarithmic Functions and especially the world population interactive.
To get the counter to tick over every time there is an increase in population by 1 person, the script divides the 1.3% per year increase by the number of milliseconds in a year (365.25 × 24 × 60 & times; 60 × 1000 =31557600000). It then triggers itself every 385.08 milliseconds (or just over 1/3 of a second), which is the time interval for the population to increase by 1.
Why do I have the counter so prominently displayed? Our planet isn't coping with the number of people it's got now. The evidence is hunger, collapsing fish stocks, inadequate clean water, pollution, global warming, overcrowding - the list goes on and on. We have to do something to reduce the present growth of around 1 billion people every decade.
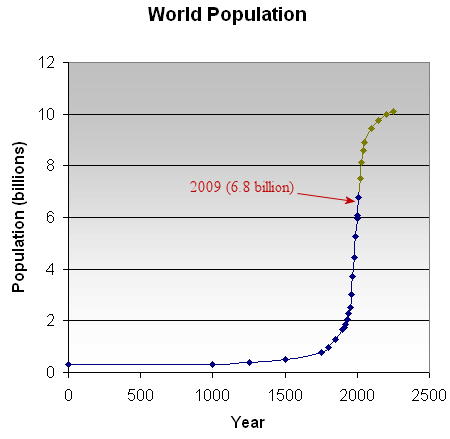
This graph shows estimates for the world population from year 0 through to 2150 (based on UN Population Data). The good news is that the rate of increase has been dropping since 1960 (when it was over 2% per year) and it is expected to drop to around 0.5% per year by 2050, by which time there will be somewhere between 10 and 12 billion people trying to survive.

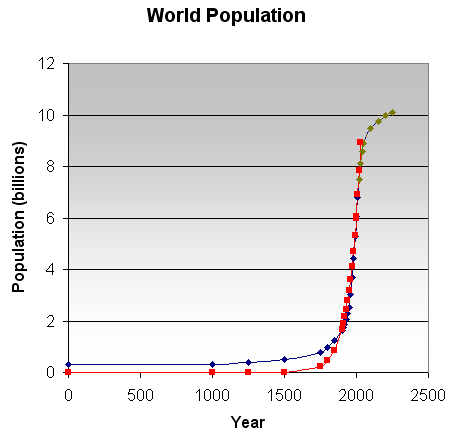
In the next chart, I have added the model P(t) = 6 × (1.013)(t-2000), using the year 2000 as the base (in red). It is quite a good fit for the period from around 1800 to now.

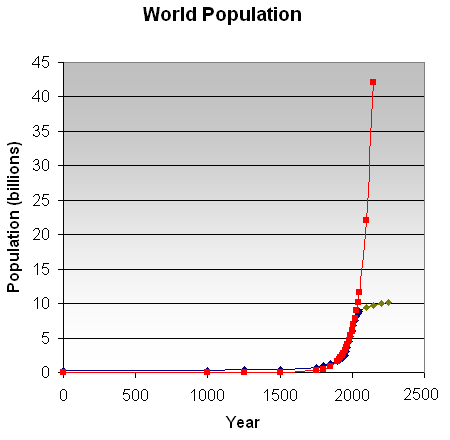
Next, we see what would happen if the current growth rate of 1.3% per year were to continue. By 2150 we would have over 40 billion people. What a nightmare.

The study of populations is fascinating and an interesting career option. "Demographics" looks at particular aspects of populations (like aging) and is also a worthwhile field to pursue.
3. Latest IntMath Poll
The results for the latest IntMath Poll are in. Readers were asked how many books they intended to read over the summer holidays (aimed at those of you in the Northern Hemisphere, of course).
How is it relevant to math? Well, reading a lot means you understand better how the world works, and your vocabulary is better. So when you come across new concepts in math, you are less scared about the new words and can concentrate on the meaning of those new words.
The poll results:
32% One book per month
32% One book per week
22% No books
14% One book per day
The 22% who didn't read at all over the holidays have missed a great opportunity. Maybe next summer?
The new IntMath Poll asks readers about their hand phone use in class. This will be an interesting result! You can vote on any page in Interactive Mathematics.
4. From the math blog
a) A Mathematician's Lament - how math is being taught all wrong
Why is math boring for so many students?
b) When zombies attack - a mathematical model
This article uses math to predict what will happen if there is a zombie outbreak.
c) Math and the dating game - The Carol Syndrome
Probability explains that curse of the super-beautiful - it's hard to find a mate.
Final thought - Keep it simple
Have you ever realized that nearly all the math that you ever see in school involves just 4 things - addition, subtraction, multiplication and division? The day I figured that out was the day I stopped worrying about how difficult math seemed and I began to really enjoy it.
There is some truth in the following quote. Don't make life (and math) more complicated than it needs to be.
Any fool can make things bigger, more complex, and more violent. It takes a touch of genius — and a lot of courage — to move in the opposite direction.
~ Albert Einstein
Until next time, enjoy your new school year.
See the 14 Comments below.
25 Aug 2009 at 2:48 pm [Comment permalink]
Hi Murray. i was just intrigued by the increase of the world population.
i think it's pretty essential that most countries should increase their population as to not have some countries with more people to dominate most of the economic market.
but on the other hand, it sure does affect as u said, global warming, over crowded etc. it affects our food chain too i presume. more human, less animal to eat.
nevertheless, wouldnt it be timely that now we should encourage more food production and also more R&D on green technologies as to protect our environment?
well anyways, i guess this is indeed a very interesting topic. would be good to hear from you.
cheers.
25 Aug 2009 at 3:26 pm [Comment permalink]
There was great fear in the 1960s when the birth rate was at its highest that everyone was going to starve. Then along came the Green Revolution and with it, massive increases in crop yields.
There are those who believe we have plenty of land and will be able to feed a population of 12 billion. But let's also consider the quality of life for those 12 billion. Add rising sea levels and you have a picture that is not pretty.
26 Aug 2009 at 8:56 am [Comment permalink]
Thanks Murray,
I really enjoy your mails
Cheers
Frank
26 Aug 2009 at 9:13 am [Comment permalink]
Wow, Murray! That Calculus_Made_Easy_Thompson.pdf is amazing! Was it really published in 1914!??
Thank you very much for all that you do. I plan to share this with my kids when they get a bit older and before they get intimidated by the usual texts.
Sincerely,
Harold
26 Aug 2009 at 9:15 am [Comment permalink]
Great newsletter. I'm also worried about population growth, but in my country, they worry more about not enough babies!
Crazy world.
26 Aug 2009 at 10:34 am [Comment permalink]
Yes, Harold, the Calculus Made Easy book is an old classic. Why do so many textbooks make it harder than it really is?
Thanks, Steve. Yes, the rapid aging of society in many developed countries is causing concern. With 20% of couples unable to have children, perhaps more of us should adopt children from poorer countries?
26 Aug 2009 at 8:39 pm [Comment permalink]
Dear Mr.Murray,
Iam previllaged to have received this edition of intmath newsletter, particularly the area of logarithms and the explanations regarding exponential functions.
You presented a unique and simplified form of dealing with pratical maths problems. Iam looking forward for more editions of intmath!
29 Aug 2009 at 7:24 pm [Comment permalink]
Yes, the informaton of this site is very usefull that helps me alot in my math problem and computation....
11 Sep 2009 at 8:50 pm [Comment permalink]
hi dear murry am very happy to be prt of the few who recieve the math latter from you it is very interesting and it has taught me alot iam hoping to recieve more from you. am 25 am finishing my degree in bachelor of science (math, physics)at makerere university uganda east africa but iwould like to go for masters but finance and scholorships are had to get in out country uganda and iwould like to interact with more friends who are interested in math and may be teaching yuong peaple more about math and also attract them to join math
11 Sep 2009 at 8:54 pm [Comment permalink]
Hi Kintu and welcome. All the best hunting down a scholarship!
25 Sep 2009 at 6:03 pm [Comment permalink]
Dear Mr.Murray,can you give an explanation about (logic)
0 implies 1 is true.thank you very much.
26 Sep 2009 at 9:53 am [Comment permalink]
Hi r?fat
I don't have any sections on logic in IntMath (yet). Maybe these resources will help:
http://archives.math.utk.edu/topics/logic.html
1 Feb 2016 at 11:54 pm [Comment permalink]
What is the formula for exponential growth?
2 Feb 2016 at 8:24 am [Comment permalink]
@Anonymous: This should help: https://www.intmath.com/exponential-logarithmic-functions/1-definitions-exp-log-fns.php