IntMath Newsletter: Desmos competition, resources, math movies
By Murray Bourne, 28 Feb 2020
28 Feb 2020
In this Newsletter:
1. Competition: Desmos
2. Resources: Wolfram, Worldometers
3. Math in the news: Trendlines, photos
4. Math movies: Irrational, Hollywood math
5. Math puzzles
6. Final thought: Hot air
1. Competition - Desmos
Here's a competition that helps develop graphing abilities.
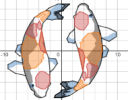 |
Open to students in 3 different age brackets, the competition encourages you to create art using Desmos Graphing Calculator. The prize money is $500 for first prize. |
Submissions are due by 10th April 2020.
Desmos is a brilliant free graphing tool, and this would be a good way for students to learn how to use it.
2. Resources
(a) Wolfram summer school
This would be a great opportunity to learn about what's going on in the world of computer math. It's to be held at Bentley University, Massachusetts, and financial aid is possible.
 |
There are 3 tracks available: Science, Technology & Innovation, and Educational Innovation.
See: 18th Annual Wolfram Summer School, June 28–July 17, 2020 |
(b) Worldometers
I recently read the book Empty Planet: The Shock of Global Population Decline by D. Bricker and J. Ibbitson, which argues that one of our problems this century won't be overpopulation, rather it will be falling populations.
Already there are several countries which are going through population declines, such as Russia, Japan and South Korea. China's fertility rate of 1.5 means it's probably going to see peak population as soon as 2023.
 |
Worldometers contains some fascinating statistics.
See: |
Here is a list of countries whose demographics I found particularly interesting:
Some of these countries don't have a population "pyramid" at all (the "normal" pattern where there are more children than adults, forming a triangle) and some have a very narrow base (like the Singapore one I used in the image above). Already a lot of schools have been closed or merged as the school-age cohort size drops in Singapore.
Also, don't miss the data on coal reserves and use which explains most countries' reluctance to let it go.
3. Math in the News
(a) Using polynomials for trendlines
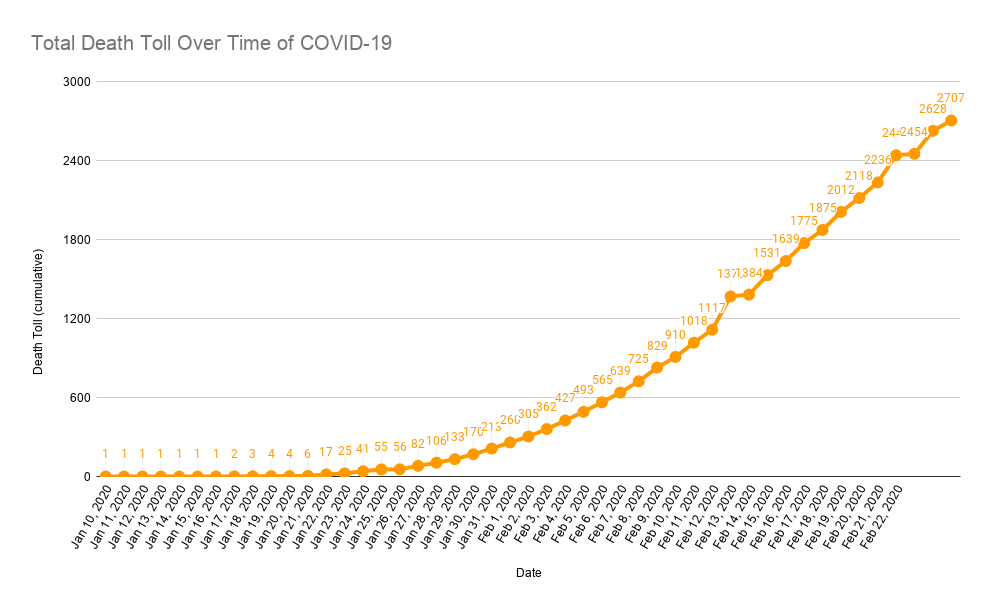
It's challenging to interpret the counts of those affected by COVID-19. In the article Here’s Why There Are So Few Reported Covid-19 Fatalities Today, the authors added a (very light) polynomial line of best fit to the chart of coronavirus data.
The polynomial appears to be a quadratic (highest power 2) or cubic (power 3) polynomial. The problem is (in their graph) the portion near the start of the outbreak is not so good as it suggests the number of cases was above zero then dropped at the beginning.
I had another go (using Google Sheets) and produced the following, using a quartic (highest power 4) and it appears to be a very close fit, and it behaves well near 0, the start of the epidemic.
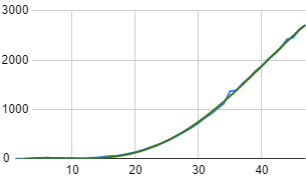
Covid-19 trend data using 4th-degree polynomial
[Data source]
Actually, most populations (including diseases) don't tend to follow a polynomial path (which will continue to grow forever), rather they have the shape of the logistic equation, which you can see in action in this page: Predicting AIDS. The hope then, of course, is that it will follow an exponential decay pattern and die off.
People behave irrationally when these things happen. The actions of panicking people are usually more dangerous than the disease itself. Please call out anyone who exhibits prejudice against Chinese people (including boycotting their businesses for no reason). We can and must be better than that.
(b) Using math to take great photos

Eclipse photo by Joshua Cripps
Former engineer Joshua Cripps made use of the app Photopills which helps you plan that perfect nature shot involving the moon, sun, stars or planets.
Read how he calculated the exact distance he needed to be from the sand dune and the camel — using the angle of the sun from the horizon (6.5o) — to create this superb photograph.
See: Photographer Shoots A Stunning Photograph That Took Ages To Plan
3. Math Movies
(a) Do politics make us irrational?
 |
This video tells the story of an interesting math test. |
The video helps explain some of the polarization we see in many countries today. Here's a quote:
"We’re strongly motivated to defend our group identities, protecting both our sense of self and our social communities. But this becomes a problem when the group’s beliefs are at odds with reality. People are often more motivated to maintain a positive relationship with their group than perceive the world accurately."
If more people would stop getting their "news" from anti-social media, and did more independent fact checking, we'd all be heading in a better direction.
(b) Movies based on math
Here's a list of movies where the main character(s) are mathematicians. If you can find any of these, they're well worth a look.
- The Man Who Knew Infinity: A brilliant telling of the story of Ramanujan, the Indian mathematician who gained a place at Cambridge University during WWI. (Released 2016)
- Hidden Figures: Based on the story of black women mathematicians who weorked for NASA in the 1960s, and faced gender and racial discrimination. (2016)
- The Theory of Everything: Stephen Hawking's story, captured sensitively by Eddie Redmayne. (2014)
- The Imitation Game: The story of Alan Turing who was involved in decrypting German messages in WWII, and went on to being an early researcher in computer science. Starring Benedict Cumberbatch. (2014)
- A Brilliant Young Mind: A teenage math prodigy competes at the International Mathematics Olympiad, meanwhile developing a friendship with a Taiwanese competitor. (2014)
- Moneyball: Biographical sports drama where a team's baseball game improves based on data. (2011)
- 21: Six MIT students are trained to become experts in card counting in Las Vegas casinos and they won millions, in a case of applied probability. The film stars Jim Sturgess, Kate Bosworth and Kevin Spacey.
(2008) - Proof: When a mentally ill mathematician dies, his daughter is confronted with her own state of mind. Starring Gwyneth Paltrow and Anthony Hopkins. (2005)
- A Beautiful Mind: Based on the life of Nobel Prizewinner John Nash, starring Russell Crowe. (2001)
- Enigma: The background to this love story is the code-breaking team in WWII's Bletchley Park. (2001)
- Good Will Hunting: About mathematician Will Hunting, starring Robin Williams, Matt Damon, Ben Affleck. (1997)
- Stand and Deliver: Jaime Escalante is a high school math teacher who does a great job of challenging and eventually winning over his raucous students. (1988)
- Rain Man: About an autistic savant, based on Kim Peek's story. Starring Dustin Hoffman and Tom Cruise. (1988)
Do you have any other math-based movies to recommend? You can do so here.
4. Math puzzles
(a) Solutions
We've got 2 puzzle solutions to discuss.
(i) The puzzle in the December IntMath Newsletter involved a substitution cipher. A correct answer was provided by Thomas.
Here is the solution (where 4 and 6 are interchangeable):
          1 0 4
      1 9 7 2 2
   +  8 2 5 2 6
   ------------
    1 0 2 3 5 2
(ii) The puzzle in the last Newsletter (January) involved 3 runners. Correct solutions with sufficient working (and as usual, an interesting variety of approaches) were provided by: Eamon, Trevor, Saikrishna, Gerard and Thomas.
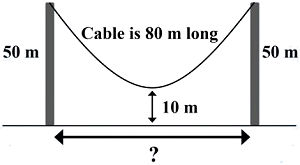
New math puzzle: Poles
What's the distance between the poles?
You can leave your responses here.
5. Final thought - Australia's temperature records in December
In December 2019, Australia recorded its two hottest days on record. On Dec. 18, the nationally-averaged maximum temperature was 41.9oC, representing 3.21oC above average. For the whole of December, the national mean maximum was 4.15oC above average. [Source]
December was the driest on record [Source], leading to the shocking bushfires experienced over much of the south east of the country .

Red indicates where 2019 was the hottest year since 2003
In Newly released satellite data reveals the patterns of record warmth in 2019 there are several charts indicating where things are heating up worldwide.
The window for doing anything meaningful is closing. Who are you going to vote for?
Until next time, enjoy whatever you learn.
See the 8 Comments below.
28 Feb 2020 at 5:51 pm [Comment permalink]
Zero! (But I didn't see the trick, had to look it up!)
28 Feb 2020 at 5:56 pm [Comment permalink]
The distance between the poles is zero-meters. If one places the 50 m poles next to each other hangs the 80 m rope on both sides, it will fold in half (40 m) and reach down to 10 m above the ground.
I remember being stumped by this puzzle 40 years ago by a chemical engineering professor... never figured I'd bump into it again. Thanks for the memories!
28 Feb 2020 at 8:04 pm [Comment permalink]
Assuming no elongation of the cable under its own weight, the poles have to be touching right?
If the cable is 80m long, half the cable is 40m and that's all the height we have between the top of the pole and 10 up from the ground. So it would need to be pinched together.
My first pass through thinking about this was how a materials scientist would approach it - the shape of the catinery sag will vary depending on the stiffness and mass..
29 Feb 2020 at 11:58 pm [Comment permalink]
The cable is 80m, the fall is 50-10 = 40m; so if the 2 ends hang from the same fixing, the fall will always be something less than 40m.
This only after re-reading the question, and after several frustrating Google visits to 'catenary'. I even designed a scale model involving graph paper, string, pins, a pin-board, and a rule.
Boy, do I feel dumb!
If the height from the floor was greater than 10m, I would have had these results -
20m, 425m
25m, 575m
30m, 650m
35m, 725m
40m, 759m
1 Mar 2020 at 4:19 am [Comment permalink]
The distance between the poles is 0 m.
(Does a zero value require unit identification ?)
Sag
= Pole Height - Dip Height over ground
= 50 - 10
= 40 m
The only way to obtain a 40m sag with an 80 m rope,
is to take it down vertically for 40 m and back up
to the same point with the remaining 40 m.
So there is no rope to allow a distance between poles!
This is an ideal solution, as a typical rope would not have
sufficient density to form the required abrupt u-turn to
achieve the full 40m sag.
2 Mar 2020 at 3:07 am [Comment permalink]
I see no data and no math which supports the following statements from the recent news letter. "The window for doing anything meaningful is closing. Who are you going to vote for?" You obviously have very strong beliefs about this and I must say perhaps you should really listen to the excellent video linked in your new letter about political bias.
Finally, including statements such as these in a Math newsletter is just as uncalled for as entertainers telling us how to live and what to believe. Like you, they have a right to say what they want, but it is ridicules to think that such unsupported, statements should change minds on important topics that deserve careful consideration.
27 Mar 2020 at 2:05 pm [Comment permalink]
@Don: Are you serious? Evidence for global warming has been shared since the 1970s and talk of tipping points has been becoming more urgent in the last few years. As an example, with Bolsanaro's crazy encouragement of Amazon destruction, it's looking increasingly likely the ecosystem could collapse in the next 3 decades.
The window is closing - be careful who you vote for.
30 May 2020 at 6:21 pm [Comment permalink]
The distance between poles is 8.9862 m.