H1N1 and the Logistic Equation
By Murray Bourne, 03 Oct 2009
The Northern Hemisphere is bracing for an outbreak of H1N1 flu this winter.
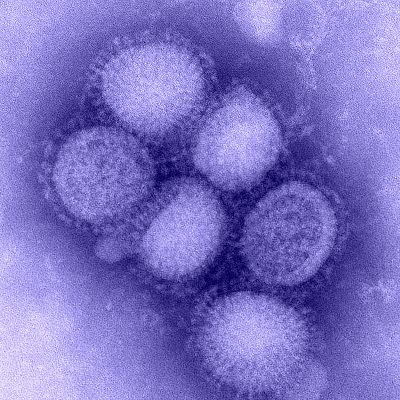
H1N1 virus [Image source: ACU]
According to the World Health Organization (WHO):
As of 27 September 2009, worldwide there have been more than 340,000 laboratory confirmed cases of pandemic influenza H1N1 in 2009 and over 4100 deaths reported to WHO.
The H1N1 virus is still in an exponential growth phase (it grows faster as time goes on). But populations don’t continue to increase exponentially forever. For example, we all know that rabbits breed very quickly, but if the supply of grass runs out, this will put a limit on their population growth.
Likewise with diseases, there is a limit to their growth. If the disease kills too many people, it will have nowhere to go and its growth will taper off over time and the number of new people affected will eventually drop.
Such a situation can be described by the Logistic Equation. This equation describes the case where a population initially grows in an exponential fashion, then tapers off to some constant value.
A simple form of the logistic equation is as follows (where P(t) is the population at time t and "e" is the constant e = 2.718 281 828...):
The graph of this logistic equation has an elongated “S” shape, as follows:
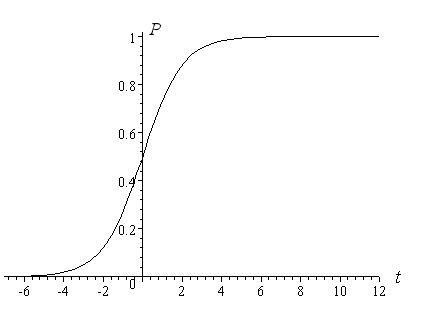
Notice that the early portion of the graph (up to t = 0) represents exponential growth, while from there, the growth tapers off and eventually the value of P becomes a constant value of 1.
Logistic equations result from solving certain Differential Equations (a topic in calculus).
The above model is too simple for discussing H1N1 (for starters, we can't have fractional populations). A more useful form of the logistic equation is:
The variables in the above equation are as follows:
P0 = population at time t = 0
K = final population after some (long) time, also called the "carrying capacity", which limits growth
r = initial growth rate
An example for the H1N1 outbreak might be as follows. Say there is a town with 1000 people and one day, 20 people wake up with H1N1. The virus eventually affects everyone in the town.
So P0 = 20 people affected, K = 1000 and we have (say) r = 0.2. Substituting these into the logistics equation and simplifying gives the following expression for the number of people affected by H1N1 at time t (in days):
Here is the graph of the situation:
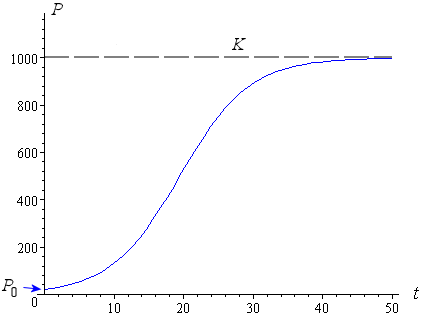
We see that eventually everyone in the town is affected after about 50 days.
Real Example
Mexico first noticed an outbreak of H1N1 in Mar 2009. The number of cases grew rapidly to 26 Apr, then rapidly declined.
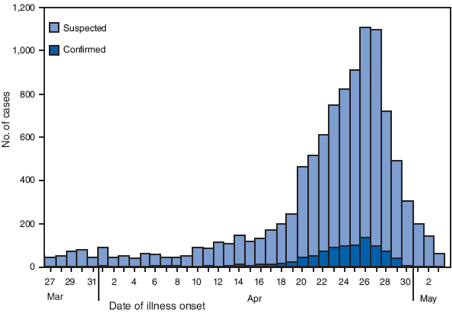
[Image source].
If we take cumulative totals for the new cases (add each new number of cases to the total so far) and graph the result over the 53 worst days of the outbreak, we obtain the following.
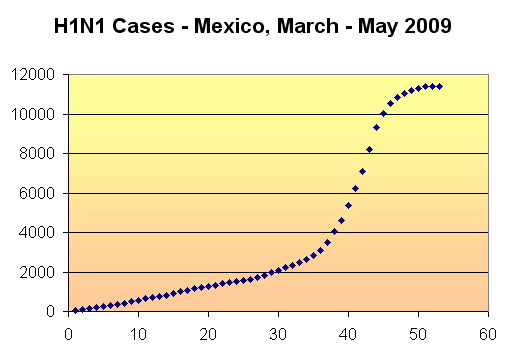
At first, the growth is somewhat linear (up to day 30), then it resembles the logistic equation curve from then on.
You can see more on this topic here: Predicting the spread of AIDS using differential equations.
Logistic equations are also used when analyzing problems in neural networks, statistics, medicine, chemistry and physics.
See the 16 Comments below.
4 Oct 2009 at 2:10 am [Comment permalink]
Thanks - I posted this on my blog at Spread of H1N1 (swine) flu and mathematics.
4 Oct 2009 at 5:16 am [Comment permalink]
really i like this article although i doesn't take the exponential lesson yet.. can any one give me a sum up for exponential ?
4 Oct 2009 at 9:23 am [Comment permalink]
These topics and areas nowing being refered to in the newsletter are nothing short of brillant! Hours of valuable learning, refering old material, newly presented and learning new aspects of maths.
4 Oct 2009 at 9:44 am [Comment permalink]
@Maria: Thanks for your post and good to hear from you!
@Hassan: Glad you liked the article. You can learn about exponentials ("e") here: Exponential and logarithmic Functions.
@Peter: Thanks for the positive feedback - makes it all worthwhile 🙂
4 Oct 2009 at 2:41 pm [Comment permalink]
i liked this article very much.. i think this article will help my students to have a mathematical and logical approach towards problems in daily life!! looking forward for more such articles....
4 Oct 2009 at 10:42 pm [Comment permalink]
i like this article...it gives me some idea to do my research....
5 Oct 2009 at 5:29 am [Comment permalink]
Well, that is a good news to be spread also...
an interesting article of one of magnificent math applications.. thanks to you..
Best wishes
5 Oct 2009 at 10:05 am [Comment permalink]
I would be missing lots of valuable information if I had not subscribed to IntMath newsletter.
7 Oct 2009 at 9:26 am [Comment permalink]
This article helps me a lot in making my students appreciate mathematics in the real-world
8 Oct 2009 at 7:47 pm [Comment permalink]
hi this article helps me in my research.
thanks it is wonder full article.
9 Oct 2009 at 3:23 am [Comment permalink]
I become day by day more fancinating in your art 'maths.' and I 'll keep for infinity.
by the way can you but an equation to relate me to math. ?!!?!
12 Oct 2009 at 5:35 am [Comment permalink]
it is very good for broblems life solving ,,,like this
thanks ery match
27 Oct 2009 at 9:34 am [Comment permalink]
THANK YOU!!! this is perfect for my Calculus class, i really needed this for my project about analyzing equations with real life examples! thank you very much =D
9 Jun 2011 at 4:23 am [Comment permalink]
[...] I didn’t really see such graph on the web but there is the excellent FluTracker by Dr. Niman and a lot of information about the swine flu on Wikipedia. If you want to start interpreting these curves, you might be interested in reading squareCircleZ’s post about the H1N1 and the Logistic Equation. [...]
6 Mar 2020 at 8:47 am [Comment permalink]
[…] Logistic Like Curve is the expected pattern as shown with this study on H1N1. […]
19 May 2020 at 4:05 pm [Comment permalink]
Just a note - while playing around with the SIR model, it seemed to me that the \{\gamma\} I part of dI/dt was problematic. It basically assumes that the probability of recovering on a given day is a constant, independent of how long a person has been infectious. So I replaced it with n(t-Tr) where n is the total infected at time t-Tr, where Tr is the time it takes to recover. In other words, if it takes a week to recover, the rate of recovery today is the rato of infection a week ago. So this gives a seemingly more difficult delay differential equation for the "fixed" SIR model, but - It has a Logistic solution.
I don't know if you find this interesting, but I can give you a link to the notes I wrote down.