New applet: Domain and range investigation
By Murray Bourne, 09 May 2017
I recently added a new interactive applet that helps you explore the concepts of domain and range. This accompanies one of the most popular pages on IntMath, Domain and Range of a Function.
Most students don't have much trouble with finding the domain of a function (by avoiding negative values under a square root, or zero values in the denominator of a fraction), but figuring out the resulting range can be a challenge.
Many of us are visual learners and it's certainly true that if you have a reasonable idea of what a function looks like in general, then determining the domain and range is a lot easier.
For some examples of what I mean,
- A linear function (like y = 3x + 2) has no restrictions on the x-values, and all y-values will result
- A quadratic function (like y = 2x2 − 5) has no restrictions on the x-values (the domain), but only half of the possible y-values (the range) on the plane will be output
- A sine function (like y = 4 sin x) has no restrictions on the x-values, and all the resulting y-values will be between 4 and −4.
- A hyperbola (like y = 3/x) is not defined for x = 0, and the resulting y-values will be all values except 0.
How do I know these? It's from having a good idea of what each function looks like in general. I then just need to look at the specific numbers involved and can determine the domain and range without drawing a graph. But how do you learn the general shapes?
The new applet
The new interactive domain and range interactive applet allows you to explore several different functions and see what effect a change in domain makes to the range.
Here are some screen shots:
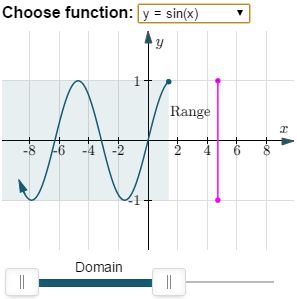
Domain and range of a sine curve
This next one has a restriction on the domain:
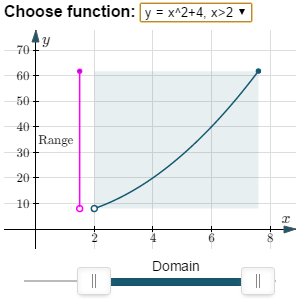
Domain and range of a parabola with restricted domain
There are also ones with discontinuities:
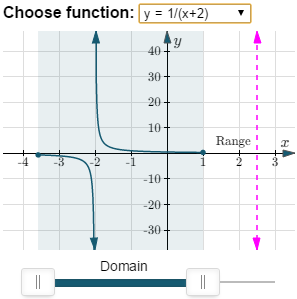
Hyperbola domain and range
Technical bit
To produce the graphs, I'm using AsciiSVG-IM.js, which creates an SVG (scalar vector graphics) image. Here's some background and a demo: AsciiSVG-IM.js Syntax and Demo. I also used this small library for the Online Graphing Calculator and Riemann Sums - Negative Integrals and Discontinuities.
Let me know what you think in the comments below.
Be the first to comment below.