How to draw y^2 = x - 2?
By Murray Bourne, 09 Apr 2009
Nuaja, a subscriber to the IntMath Newsletter, wrote recently:
How do I know how the graph should look like: For example: y2 = x - 2?
The first thing I recognize in that equation is the y2 term, which tells me it will be a parabola. (It won't be a circle, ellipse or hyperbola because there is an x term, but no x2 term. See Conic Sections.)
Let's start with the most basic parabola y = x2 and build up to the required answer.
Example 1: y = x2
You could draw up a table and calculate the y-values for a set of x-values, like this:
| x | -4 | -3 | -2 | -1 | 0 | 1 | 2 | 3 | 4 |
|---|---|---|---|---|---|---|---|---|---|
| y | 16 | 9 | 4 | 1 | 0 | 1 | 4 | 9 | 16 |
This gives us a series of points (-4,16), (-3,9), (-2,4) up to (4,16).
You then join these dots with a smooth curve and get something like the following.
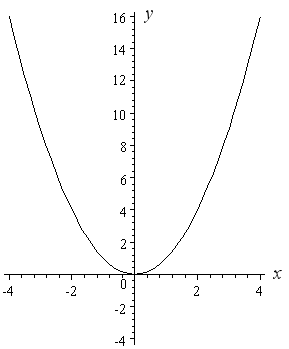
Notice that the vertex of the parabola (the "pointy" end) is at the origin, (0, 0).
Now for all the curves that I draw below, I'm not going to draw up a table. It becomes tedious, and it can lead to incorrect graphs. It is better to be able to recognize the graph type (from the equation) and then know how to sketch it in the right place and with the right orientation.
I will consider the effect of small changes to the equation and then sketch my curve.
All of the following graphs have the same size and shape as the above curve. I am just moving that curve around to show you how it works.
Example 2: y = x2 − 2
The only difference with the first graph that I drew (y = x2) and this one (y = x2 − 2) is the "minus 2". The "minus 2" means that all the y-values for the graph need to be moved down by 2 units.
So we just take our first curve and move it down 2 units. Our new curve's vertex is at −2 on the y-axis.

Next, we see how to move the curve up (rather than down).
Example 3: y = x2 + 3
The "plus 3" means we need to add 3 to all the y-values that we got for the basic curve y = x2. The resulting curve is 3 units higher than y = x2. Note that the vertex of the curve is at (0, 3) on the y-axis.

Next we see how to move a curve left and right.
Example 4: y = (x − 1)2
Note the brackets in this example - they make a big difference!
If we think about y = (x − 1)2 for a while, we realize the y-value will always be positive, except at x = 1 (where y will equal 0).
Before sketching, I will check another (easy) point to make sure I have the curve in the right place. Putting x = 0 is usually easy, so I substitute and get
y = (0 − 1)2
= 1
So the curve passes through (0, 1).
Here is the graph of y = (x − 1)2.

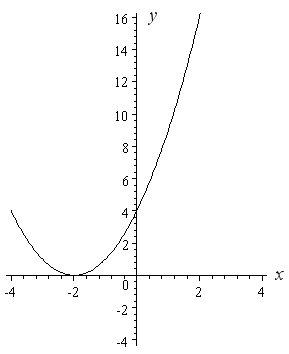
Example 5: y = (x + 2)2
With similar reasoning to the last example, I know that my curve is going to be completely above the x-axis, except at x = −2.
The "plus 2" in brackets has the effect of moving our parabola 2 units to the left.
Rotating the Parabola
The original question from Anuja asked how to draw y2 = x − 4.
In this case, we don't have a simple y with an x2 term like all of the above examples. Now we have a situation where the parabola is rotated.
Let's go through the steps, starting with a basic rotated parabola.
Example 6: y2 = x
The curve y2 = x represents a parabola rotated 90° to the right.
We actually have 2 functions,
y = √x (the top half of the parabola); and
y = −√x (the bottom half of the parabola)
Here is the curve y2 = x. It passes through (0, 0) and also (4,2) and (4,−2).
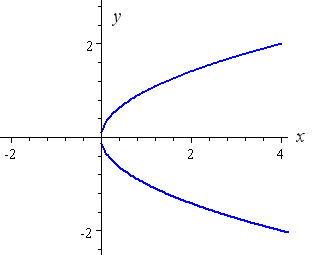
[Notice that we get 2 values of y for each value of x larger than 0. This is not a function, it is called a relation.]
Example 7: (y + 1)2 = x
If we think about the equation (y + 1)2 = x for a while, we can see that x will be positive for all values of y (since any value squared will be positive) except y = −1 (at which point x = 0).
In the equation (y + 1)2 = x, the "plus 1" in brackets has the effect of moving our rotated parabola down one unit.

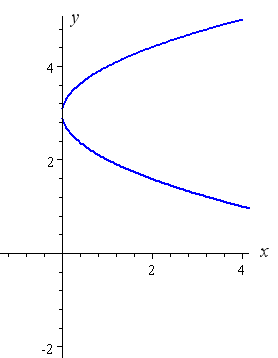
Example 8: (y − 3)2 = x
Using similar reasoning to the above example, the "minus 3" in brackets has the effect of moving the rotated parabola up 3 units.
Finally we are ready to answer the question posed by Nuaja.
Example 9: y2 = x − 2
You can hopefully imagine what is going to happen now. We have a y2 term , so it means it will be a rotated parabola.
When x = 2, y = 0. The value of x cannot be less than 2, otherwise when we try to evaluate y we would be trying to find the square root of a negative number. Since out numbers are all real numbers, x must be greater than or equal to 2.
The "minus 2" term has the effect of shifting our parabola 2 units to the right.
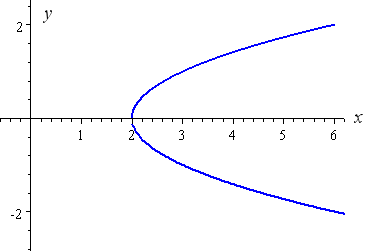
I hope you can see now that if the equation was y2 = x + 2 (with a "plus"), then we would need to shift our rotated parabola to the left by 2 units.
So Nuaja, I hope that answers your question.
Like all things, the best way how to learn graph sketching is through practice. Also, be observant and note the effect of plus, minus and brackets in each example.
See the 72 Comments below.
13 Apr 2009 at 7:49 pm [Comment permalink]
thanks, nice tip...
13 Apr 2009 at 11:17 pm [Comment permalink]
Remarkable
14 Apr 2009 at 4:37 pm [Comment permalink]
I hv learned a lot, thanks. The problem with me is integration.
14 Apr 2009 at 6:28 pm [Comment permalink]
thank you for your assistance.
14 Apr 2009 at 11:57 pm [Comment permalink]
thanks for help in maths nd i hav learned alot from this and my problem is planes
20 Apr 2009 at 5:52 pm [Comment permalink]
One word, FANTASTIC.
looking forward to the next e-mail.
21 Apr 2009 at 2:45 pm [Comment permalink]
Thanks for your explanation, it has assisted me much. Keep it up.
22 Apr 2009 at 12:49 pm [Comment permalink]
thanks for the tip i nvr knew that sketching graphs are so easy and not so tedious. thank you very much
23 Jun 2009 at 9:39 am [Comment permalink]
TNX A LOT! KEEP UP..
29 Jun 2009 at 11:42 pm [Comment permalink]
i would like to learn more about la'plase' fomulas
30 Jun 2009 at 8:08 am [Comment permalink]
Hi Masereka. Do you mean "Laplace"? You can find a chapter on it here: Laplace Transformation.
17 Aug 2009 at 10:59 pm [Comment permalink]
i do not understand how you drew the graph for y = x2( example 1)
can you please give me some pointers on how to go about doing these things
i am currently in grade 10 (std8)
plaese if any one can help
thanks alot
18 Aug 2009 at 2:53 pm [Comment permalink]
Hi Chirag. The table for example 1 is obtained by substituting the different x-values into y = x2. So for example, when x = -2, then y = (-2)2 = 4. This is graphed by putting a dot on the point (-2,4).
We then put dots for all the other points in the table (like (-4,16), then (-3,9) and so on. We join the dots with a smooth curve and end up with the parabola shown.
Hope that helps.
19 Aug 2009 at 10:25 pm [Comment permalink]
thanks alot zac that realy did help and made me think
thanks for all the help
chirag
7 Oct 2009 at 7:58 am [Comment permalink]
I was wondering how to graph y^2=x in a graphing calculator
Thanks, Zach
7 Oct 2009 at 9:00 pm [Comment permalink]
Hi Zach
Since y^2 = x − 2 is a relation (has more than 1 y-value for each x-value) and not a function (which has a maximum of 1 y-value for each x-value), we need to split it into 2 separate functions and graph them together. So the first one will be y1 = √(x − 2) and the second one is y2 = −√(x − 2). When you graph these on the same axis, it will give the required result.
4 Nov 2009 at 11:42 am [Comment permalink]
thanks i know it
3 Jan 2010 at 9:58 pm [Comment permalink]
very good
4 Jan 2010 at 4:55 am [Comment permalink]
Great examples.
2 Feb 2010 at 8:44 am [Comment permalink]
thanks so much this is so helpful!!
11 May 2010 at 3:15 pm [Comment permalink]
it's easy to understand, sketching is so important so we need programm can draw the function in moments in this good and best website.
12 May 2010 at 3:29 am [Comment permalink]
hey, thanks alot 4 d examples! it did help....
but i'm still confused on how d x and y values were derived from just an equation.
i hope u can pls shed more light on that...
thanks
12 May 2010 at 4:28 pm [Comment permalink]
@deedee: Are you referring to the table of values in Example 1?
They just come from substituting in values. The first one is x = -4, and substituting that into y = x^2 gives y = (-4)^2 = 16.
15 May 2010 at 2:02 pm [Comment permalink]
Hi,
I woul like to know how to find the simplest general formua of parabolic graph? and you can find the tangent line in it?
thank you.
15 May 2010 at 3:01 pm [Comment permalink]
Hi Shamsa. The simplest general formula for a parabola is given in the article: y = ax2 + bx + c.
You can find how to differentiate polynomials here: Derivatives of Polynomials.
Later on that page is an example of a tangent line.
7 Jun 2010 at 5:01 am [Comment permalink]
how do u find the parabola if all the numbers are positive?????
7 Jun 2010 at 9:34 am [Comment permalink]
Hello jr. Do you mean if the question was y^2 = x + 2? Well, instead of moving the parabola to the right by 2 units (like I did at the end in the above example), you would move it to the left by 2 units, as mentioned below the final graph.
1 Aug 2010 at 1:18 am [Comment permalink]
How would you draw a graph if the question is only half a parabola?
y^2= √(-8x)
1 Aug 2010 at 7:37 am [Comment permalink]
It's actually a "full" parabola, Caitlyn. The negative in front of the x just flips the parabola through the y-axis so the arms face to the left, instead of the right like the final examples above.
25 Aug 2010 at 9:42 pm [Comment permalink]
Gret site. Thanks. I agree that this site is rather cognitive and useful especially for professionals.
27 Dec 2010 at 12:24 am [Comment permalink]
But how to draw a y=2-x^2..
27 Dec 2010 at 9:53 pm [Comment permalink]
Hi Jovan
Well, first can you sketch y = -x^2?
Then, what does the 2 out the front do?
18 Jan 2011 at 12:43 am [Comment permalink]
How i can draw the graph of parabola when only two points are given.
18 Jan 2011 at 8:53 am [Comment permalink]
@Tamarat: There are an infinite number of parabolas passing through 2 points. You always need 3 points to determine a parabola, and you also have to specify the direction of the axis (vertical, horizontal or at an angle).
27 Jan 2011 at 9:50 pm [Comment permalink]
sir,
if i want to plot same function by finding intercepts and slopes,then y intercept will involve complex numbers. what it means?,cant i plot it if i take my y axis as imaginary axis?,in that case graph would be different.
28 Jan 2011 at 9:23 am [Comment permalink]
@Gagangc: Interesting question! All the plots on this page assume real axes. You could, I guess, plot the ones involving complex numbers on the 3D complex plane, and the result would be something like the ones on this page: exponential 3D plots.
16 Feb 2011 at 2:12 am [Comment permalink]
Sir,
i tried sketching xy = 4 (hyperbola),using curve sketching by differentiation,i got x and y intercepts as infinity which i understood.but problem came when i tried finding maxima and minima as i had to equate (-4)/(x^2) to 0.what is it telling to me??i could not come to any conclusion.problem got bigger when i found second derivative.help me find solution.
16 Feb 2011 at 9:33 am [Comment permalink]
@gagangc: A hyperbola in this orientation doesn't have a maximum or minimum! You'll find an example similar to your question on this page: Hyperbola.
20 Feb 2011 at 5:32 pm [Comment permalink]
Sir,
If the real roots of a quadratic eqn are the x-intercepts, what do imaginary roots represent graphically?.(as in x^2+9).i am bit confused regarding this,help me to get out of this problem.
20 Feb 2011 at 8:49 pm [Comment permalink]
@gagangc: You can't represent complex roots on a real cartesian plane. However, we can plot complex numbers on the complex plane (with "reals" on the horizontal axis and "imaginary" on the vertical axis).
See: Graphical representation of complex numbers.
13 May 2011 at 7:34 pm [Comment permalink]
Finding these graph difficult to do. Could someone help me with sketch the graph of y squared = 25 - x squared I need to know how to work it out so we can apply it to other values. thanks.
14 May 2011 at 11:28 am [Comment permalink]
Hi Brenda
Just add x^2 to both sides and then check out this page that explains circles.
12 Jun 2011 at 10:57 pm [Comment permalink]
how to sketch the graph of x=(y-2)^2 +4 ?? thank you 😀
16 Jun 2011 at 7:03 am [Comment permalink]
Hello Cheryl. The answer for your question is contained in the article!
Is your graph a parabola?
What orientation does it have? (Legs up? Right? Left? Down?)
What does the "-2" in the brackets do?
What does the "+4" do?
14 Nov 2011 at 11:32 am [Comment permalink]
y=(x-2)*2
13 Jan 2012 at 11:16 am [Comment permalink]
Great explanation thanks, it's good when you can visualize what is going on.
5 Mar 2012 at 5:22 am [Comment permalink]
how do you do y = x2 + 3x +3
5 Mar 2012 at 9:46 am [Comment permalink]
@Gummi and Arthur: This page will help: Graph of a Quadratic Function.
14 Jun 2013 at 7:27 pm [Comment permalink]
how to draw the graph of |x|+|y|=1
26 Jan 2014 at 11:11 pm [Comment permalink]
You should teach my pre-calc class instead
21 Nov 2014 at 6:11 pm [Comment permalink]
I want to know how you can define the parabolas :
zx = y^2
zy = x^2
zy = -x^2
zx = -y^2
as one unified equation? the property of a parabola that i am most interested in is how it approaches its respective axis asymptotically as z grows (or shrinks). how would one define these parabolas with one equation? is it even possible? does anyone know what i'm talking about?
for example, if zx = y^2 and zx = -y^2, how would one express that zx = y^2 and zx = -y^2 simultaneously?
23 Nov 2014 at 2:36 pm [Comment permalink]
Hello Amrit
Actually, these parabolas won't "approach any axis asymptotically". A parabola's axis is the line that cuts the parabola into 2 equal halves (so each parabola cuts its axis once only, at the vertex.)
Probably the best you can do in terms of expressing these as one equation is to settle for 2.
(zx)^2 = y^2 will give your 1st and 4th equations
(zy)^2 = x^2 will give your 2nd and 3rd equations
Or perhaps you could set it up as a linear sum:
a (zx)^2 + b (zy)^2 = a y^2 + b x^2
Then if a = 1 and b = 0, you have your 1st and 4th cases, and a = 0, b = 1 gives you the 2nd and 3rd cases.
Regards
23 Nov 2014 at 3:13 pm [Comment permalink]
Hey Murray,
thanks for the insights! that helps me a ton.
what i meant by the parabola reaching its axis asymptotically, i should have been more clear. consider this equation:
x = - y^2/z
that's just one example of the four equations i was originally working with. this parabola opens along the negative x axis. so, consider what happens to the equation as z goes to infinity. what i was trying to say is that the parabola opens wider and wider until it is asymptotically approaching the y axis. it will eventually appear flat, but is really extending asymptotically along the y-axis.
does that make sense?
when you say "1st and 4th cases" and "3rd and 2nd cases," what exactly did you mean? won't a and b be any arbitrary number? so, aren't there an infinite number of cases?
what if a and b are fractions?
thanks for having the discussion and for getting me closer to what i'm trying to express, which is a unified equation of energy and mass. i'm trying to suggest that Einstein was wrong to include c^2 in his famous equation. these equations are essential to proving that. 🙂
24 Nov 2014 at 10:38 am [Comment permalink]
Hi Amrit
I originally read your "zx" as zx, but now that I see you mean
z = y^2 / x,
it makes a lot more sense.
Indeed, there are asymptotes going on here.
The above graph looks like this:
There is a vertical "wall" that should not actually appear in the graph - it is actually the asymptote.
Here I've added z = x^2 / y:
Next, here are all 4 of your graphs:
I still don't believe it's possible to achieve one single equation.
This would give you 2 of them (your first and last):
z^2 = y^4 / x^2
And this would give you the other 2:
z^2 = x^4 / y^2
Regards
24 Nov 2014 at 2:38 pm [Comment permalink]
Hi Murray,
z is actually a constant. how does that change things?
sorry i have been so unclear. this is a learning process for me because i have forgotten all my algebra. where i am going with all of this might have me take a derivative because i am actually looking for the equation that will give me the volume of the sphere that would sit on all these equations.
like, in your third drawing, imagine setting a sphere flush to the parabolas and now calculate its volume, or mass even, and that is the equation i am after.
it would have infinite volume and infinite mass because all these equations are asymptotically going "up" against their limits, right? so, am i really looking for the limit as what approaches what?
again, i am uncertain what i am looking for as of yet. but your expertise is very helpful to me. so, thank you!
amrit
29 Nov 2014 at 5:44 pm [Comment permalink]
Hi Amrit
In your first post, you said "as z grows (or shrinks)", and later you said "as z goes to infinity", which means z is a variable.
Perhaps you mean it is a "variable constant".
Either way, it may be good for you to think of this as a 3-dimensional problem.
Perhaps you could get GeoGebra and play with it. See what I wrote here (similar to your equations, but different):
GeoGebra now with 3D graphs
It's a good tool for exploring these concepts - you can do it in 2D or 3D.
Regards.
24 Feb 2015 at 6:41 pm [Comment permalink]
how to graph the curve x^2+3y+4x+6=0? also the curve y^2=-x?
what is their points of intersection and the area? ^_^
24 Feb 2015 at 7:35 pm [Comment permalink]
@Christopher: For the first one, just solve it for y.
The second one can be found in the article above.
The points of intersection are found by solving the 2 equations simultaneously. See: Algebraic solution of non-linear systems.
The enclosed area is found using integration. See: Area between curves using integration
20 May 2015 at 1:41 am [Comment permalink]
I'm sorry, Dave. I'm afraid I can't do that.
Something messed up. :-(