IntMath Newsletter - Modeling
By Murray Bourne, 03 Aug 2009
In this Newsletter:
1. Math tip (a) Modeling linear functions
2. Math tip (b) Modeling parabolic functions
3. Changing lives
4. From the Math Blog
5. Final thought: Difficulties
In the last Newsletter I mentioned reader Arun who asked:
How do we form equations from a given graph of data?
This is an interesting — and important — part of "real math" that is rarely covered in schools.
This time we'll look at how to model 2 different types of relationships between variables. Let's look at linear functions first.
1. Math tip (a) – Modeling linear functions
Here are the distances achieved in the Men's Long Jump in the Summer Olympics from 1896 through to 2008.
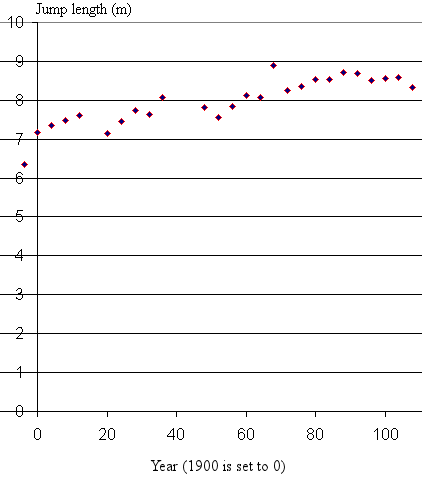
[Data from Central Queensland University's Datasets - link no longer available.]
We have regarded the year 1900 as being "t = 0" to make the numbers smaller and our lives easier. We can shift it back at the end of the problem if we need to.
Over the 112-year span, the performance has steadily improved. We can imagine a straight line passing through the middle of these data points, giving a kind of average:
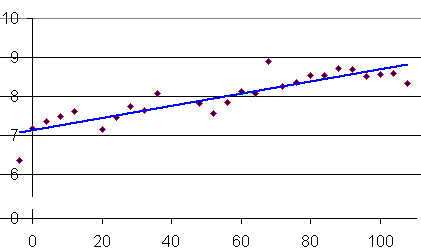
To obtain the equation for the line passing through the data, we recall the general formula for the equation of a straight line:
y = mx + c
The slope of the general line is "m" and the place where it cuts the vertical axis is "c".
For our graph above, the easiest way to work out the slope is to look at the increase in long jump length over the period from 1900 to 2000 (8.6 m − 7.1 m = 1.5 m which is the "vertical rise"), and then divide that by 100 years (the "horizontal run"):
1.5/100 = 0.015 (the units are m/year)
The vertical axis intercept is 7.1.
So the equation representing the long jump performance is
distance = 0.015 t + 7.1 (where t is in years)
We can use MS Excel to do this for us, and also we can get it to do a prediction for us. If the rate of improvement in the long jump continues, we can expect that athletes will be regularly achieving 9 m jumps by the 2020 Olympics.
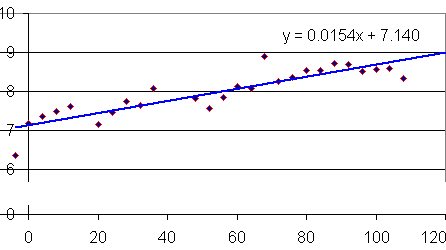
See more on how to use Excel to model data.
2. Math tip (b) – Modeling parabolic functions
Let's now move to parabolic functions. Parabolas are very commonly used to model data in mathematics, since they are beautifully simple curves with well-known characteristics.
First, for some background in parabolas, go to:
The dataset that we will work with for this example comes from a well-known fact − we all need some motivation to perform. Sometimes that motivation comes from within and sometimes it is from our friends, family or our sports coach. We know that some stimulus is good (encouragement, praise, cheering) but too much becomes counter-productive.
For example, if we are trying to learn math, a noisy cheer-leading team will be very distracting and will not allow us to concentrate. Likewise, too much caffeine can make us excitable and bubbly so we are not at our peak.
The Yerkes-Dodson Law proposed that our performance is low with low arousal, improves as arousal increases, but then drops off as arousal becomes too high.
Here are possible results of an experiment where different levels of arousal are applied while a person is trying to learn a task.
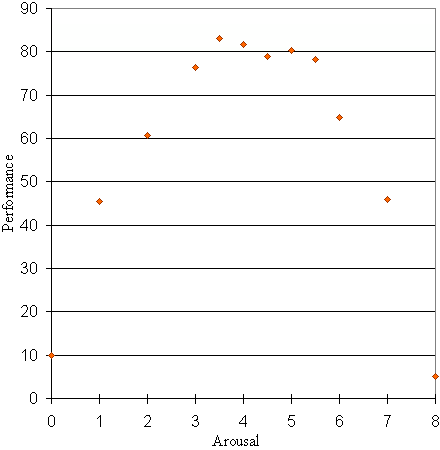
We wish to model this data and proceed to sketch a curve through the data points, as follows.
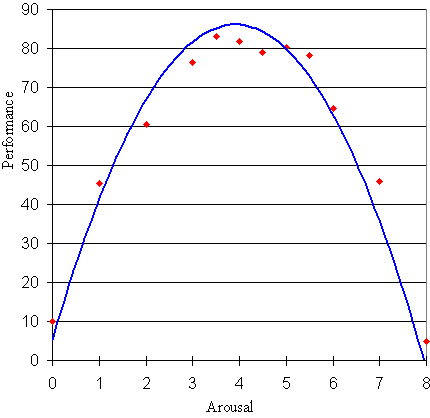
We observe that the shape of the data points is a parabola. We recall that the general equation for a parabola is given by:
y = ax2 + bx + c
Our job is to find the values of a, b and c for the above curve.
We expect variable a to be negative, since our parabola is "upside down".
We observe that the curve cuts the vertical axis (that is, when x = 0) near y = 5. So we can conclude that c = 5.
So y = ax2 + bx + 5
Now we choose 2 other points on the curve and substitute them in to our equation.
The maximum performance is at around the point (4, 87). Substituting x = 4 and y = 87 gives:
87 = a(4)2 + 4b + 5
Tidying this up gives:
82 = 16a + 4b
The point with greatest arousal is (8, 5). Substituting x = 8 and y = 5 gives:
5 = a(8)2 + 8b + 5
This gives:
0 = 64a + 8b
This gives b = -8a and substituting this into 82 = 16a + 4b gives us the value of a as −5.125.
Since b = −8a then b = 41.
So the required equation is
y = −5.1x2 + 41x + 5
Is it correct? As a check, Excel gives me y = -5.2845x2 + 41.35x + 5.2245.
3. Changing lives
I never expected my math site would have such an effect on people's lives. Here is part of a recent mail from Mengis Teame from Manchester, UK:
Your website has influenced my future career and i am choosing to become a maths teacher for at least college level and I am sure the way you explain mathematical reason and logic couldn’t have been better.
I wish Mengis (and anyone else who has been impacted by Interactive Mathematics) the very best!
4. From the Math Blog
a) Math and the dating game - The Carol Syndrome
Probability explains that curse of the super-beautiful - it's hard to find a mate.
b) Friday math movie - Biology Meets Mathematics
A group of mathematicians work on some models in the biological sciences.
c) Free mathematics books
Here's a long list of free math books in PDF form.
d) Eigenvalues produce billionaires
Google's PageRank algorithm is based on matrices - and has made its inventors into multi-billionaires.
5. Final thought – Difficulties
Here's something to think about next time you are freaking out about some math problem:
Real difficulties can be overcome; it is only the imaginary ones that are unconquerable. (Theodore N. Vail, president of AT&T telephone company over 100 years ago).
Enjoy the rest of your summer holidays, those of you in the Northern hemisphere.
Until next time.
See the 5 Comments below.
4 Aug 2009 at 1:53 am [Comment permalink]
Great article about modelling the Mens' Long Jump record. Would be great to also include the data set so that kids could explore it themselves via a spreadsheet or graphical calculator.
I've used similar tasks, asking students when will the women overtake men in the 200 metres sprint, based on historical data of world record times.
Keep up the good work. Have just been to Oxford for the Institute of Mathematics Pedagogy organised by John Mason, Anne Watson & Malcolm Swan. Thoroughly enjoyed myself.
Regards, Matt.
Alice Springs NT Australia
4 Aug 2009 at 9:19 am [Comment permalink]
Hi Matt. The dataset came from Central Queensland University's Datasets, but the link appears to be broken now. There are several other interesting datasets there which are ideal for student use.
[This reference was included in an earlier draft of the Newsletter but I forgot to add it when I rewrote that portion. I have updated the post.]
4 Aug 2009 at 11:04 pm [Comment permalink]
Thank you for the newsletter. The parabola model comes in very handy, as I have pre-calculus exam today. Thanks also for the quote, and for the list of books.
4 Aug 2009 at 11:06 pm [Comment permalink]
You're welcome, Martha. Glad it helped!
4 Aug 2009 at 11:15 pm [Comment permalink]
Iam really gratefull for this edition of the intmath newsletter, it has really stimulated my brain as a math instructor, infact i have shared it with my colleagues bearing in mind that we have a Math seminar as on 6-08-2009. We are looking forward for more!