4. The Parabola
Why study the parabola?
On this page...
Definition of a parabola
Formula of a parabola
Arch Bridges
Horizontal Axis
Shifting the Vertex
Applications
The parabola has many applications in situations where:
- Radiation often needs to be concentrated at one point (e.g. radio telescopes, pay TV dishes, solar radiation collectors); or
- Radiation needs to be transmitted from a single point into a wide parallel beam (e.g. headlight reflectors).
Here is an animation showing how parallel radio waves are collected by a parabolic antenna. The parallel rays reflect off the antenna and meet at a point (the red dot, labelled F), called the focus.
Click the "See more" button to see more examples. Each time you run it, the dish will become flatter.
Observe that the focus point, F, moves further away from the dish each time you run it.
Copyright © www.intmath.com
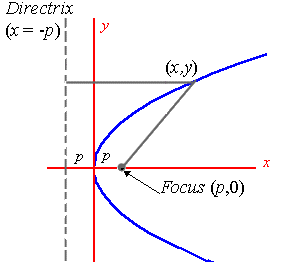
Definition of a Parabola
The parabola is defined as the locus of a point which moves so that it is always the same distance from a fixed point (called the focus) and a given line (called the directrix).
[The word locus means the set of points satisfying a given condition. See some background in Distance from a Point to a Line.]
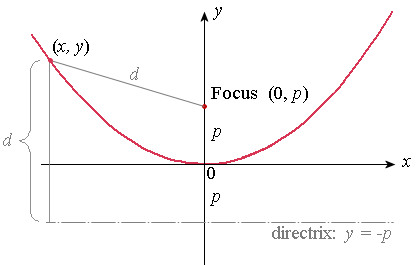
In the following graph,
- The focus of the parabola is at `(0, p)`.
- The directrix is the line `y = -p`.
- The focal distance is `|p|` (Distance from the origin to the focus, and from the origin to the directrix. We take absolute value because distance is positive.)
- The point (x, y) represents any point on the curve.
- The distance d from any point (x, y) to the focus `(0, p)` is the same as the distance from (x, y) to the directrix.
- The axis of symmetry of this parabola is the y-axis.
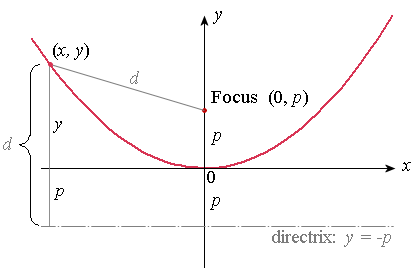
The Formula for a Parabola - Vertical Axis
Adding to our diagram from above, we see that the distance `d = y + p`.
Now, using the Distance Formula on the general points `(0, p)` and `(x, y)`, and equating it to our value `d = y + p`, we have
`sqrt((x-0)^2+(y-p)^2)=y+p`
Squaring both sides gives:
(x − 0)2 + (y − p)2 = (y + p)2
Simplifying gives us the formula for a parabola:
x2 = 4py
In more familiar form, with "y = " on the left, we can write this as:
`y=x^2/(4p)`
where p is the focal distance of the parabola.
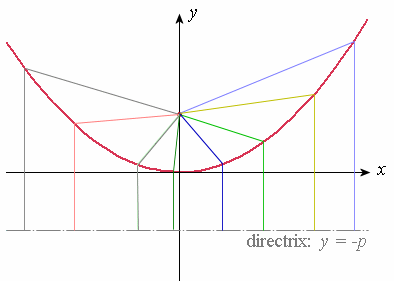
Now let's see what "the locus of points equidistant from a point to a line" means.
Each of the colour-coded line segments is the same length in this spider-like graph:
Don't miss Interactive Parabola Graphs, where you can explore concepts like focus, directrix and vertex.
Example 1 - Parabola with Vertical Axis
Need Graph Paper?

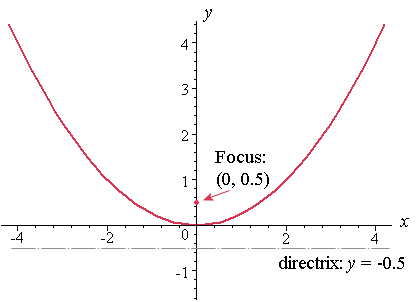
Sketch the parabola
`y=x^2/2`
Find the focal length and indicate the focus and the directrix on your graph.
Answer
The focal length is found by equating the general expression for y
`y=x^2/(4p)`
and our particular example:
`y=x^2/2`
So we have:
`x^2/(4p)=x^2/2`
This gives `p = 0.5`.
So the focus will be at `(0, 0.5)` and the directrix is the line `y = -0.5`.
Our curve is as follows:
Note: Even though the sides look as though they become straight as x increases, in fact they do not. The sides of a parabola just get steeper and steeper (but are never vertical, either).
Arch Bridges − Almost Parabolic

The Gladesville Bridge in Sydney, Australia was the longest single span concrete arched bridge in the world when it was constructed in 1964.
The shape of the arch is almost parabolic, as you can see in this image with a superimposed graph of y = −x2 (The negative means the legs of the parabola face downwards.)
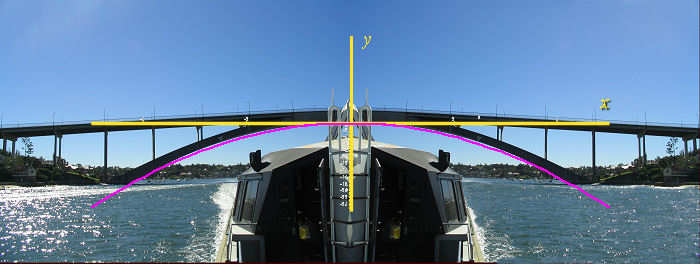
[Actually, such bridges are normally in the shape of a catenary, but that is beyond the scope of this chapter. See Is the Gateway Arch a Parabola?]
Parabolas with Horizontal Axis
We can also have the situation where the axis of the parabola is horizontal:
In this case, we have the relation: (not function)
y2 = 4px
[In a relation, there are two or more values of y for each value of x. On the other hand, a function only has one value of y for each value of x.]
The above graph's axis of symmetry is the x-axis.
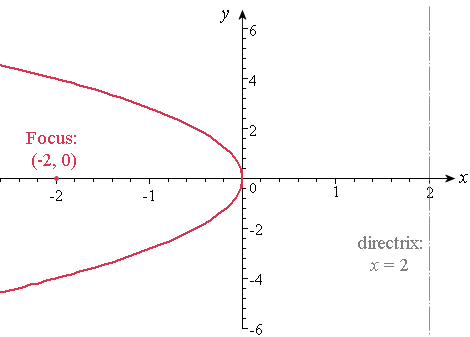
Example 2 - Parabola with Horizontal Axis
Sketch the curve and find the equation of the parabola with focus (−2,0) and directrix x = 2.
Answer
In this case, we have the following graph:
After sketching, we can see that the equation required is in the following form, since we have a horizontal axis:
`y^2 = 4px`
Since `p = -2` (from the question), we can directly write the equation of the parabola:
`y^2 = -8x`
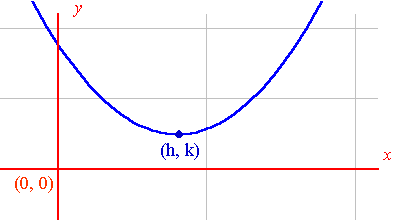
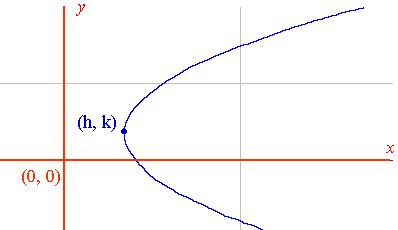
Shifting the Vertex of a Parabola from the Origin
This is a similar concept to the case when we shifted the centre of a circle from the origin.
To shift the vertex of a parabola from (0, 0) to (h, k), each x in the equation becomes (x − h) and each y becomes (y − k).
So if the axis of a parabola is vertical, and the vertex is at (h, k), we have
(x − h)2 = 4p(y − k)
In the above case, the axis of symmetry is the vertical line through the point (h, k), that is x = h.
If the axis of a parabola is horizontal, and the vertex is at (h, k), the equation becomes
(y − k)2 = 4p(x − h)
In the above case, the axis of symmetry is the horizontal line through the point (h, k), that is y = k.
Exercises
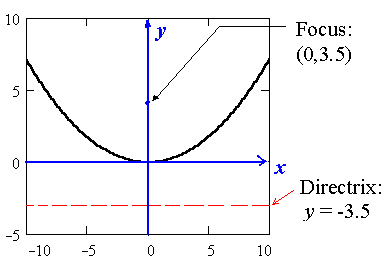
1. Sketch `x^2= 14y`
Answer
`x^2= 14y`
Focus:
`4p = 14`
so
`p = 14/4 = 3.5`
So the focus is at `(0, 3.5)`
Directrix: `y = -3.5`
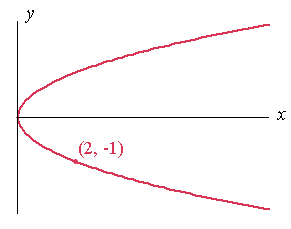
2. Find the equation of the parabola having vertex (0, 0), axis along the x-axis and passing through (2, −1).
Answer
The curve must have the following orientation, since we know it has horizontal axis and passes through `(2, -1)`:
So we need to use the general formula for a parabola with horizontal axis:
`y^2= 4px`
We need to find `p`. We know the curve goes through `(2, -1)`, so we substitute:
`(-1)^2= 4(p)(2) `
→ `1 = 8p`
→ `p = 1/8`.
So the required equation is `y^2=x/2`.
3. We found above that the equation of the parabola with vertex (h, k) and axis parallel to the y-axis is
`(x − h)^2= 4p(y − k)`.
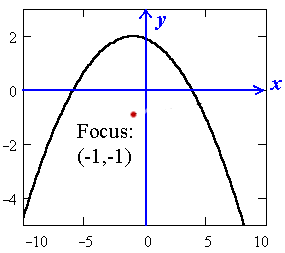
Sketch the parabola for which `(h, k)` is ` (-1,2)` and `p= -3`.
Answer
We will have vertex at `(-1,2)` and `p = -3` (so the parabola will be "upside down").
The vertex is at `(-1, 2)`, since we know the focal distance is | p | = 3.
We don't really need to find the equation, but as an exercise:
Using
`(x − h)^2 = 4p(y − k) `
We have:
`(x + 1)^2 = 4(-3)(y − 2) ``x^2 + 2x + 1 = -12y + 24`
`12y = -x^2 − 2x − 1 + 24`
`y = (-x^2 − 2x + 23)/12`
Helpful article and graph interactives
See also: How to draw y^2 = x − 2?, which has an extensive explanation of how to manipulate parabola graphs, depending on the formula given.
Also, don't miss Interactive Parabola Graphs, where you can explore parabolas by moving them around and changing parameters.
Applications of Parabolas
Application 1 - Antennas
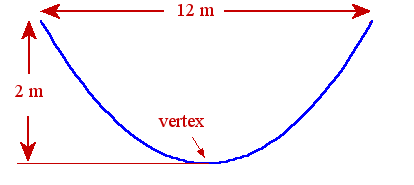
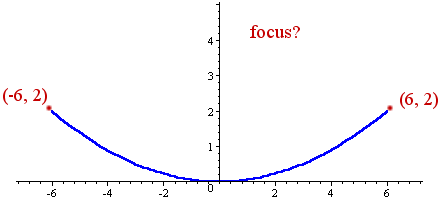
A parabolic antenna has a cross-section of width 12 m and depth of 2 m. Where should the receiver be placed for best reception?
Answer
The receiver should be placed at the focus of the parabolic dish for best reception, because the incoming signal will be concentrated at the focus.
We place the vertex of the parabola at the origin (for convenience) and use the equation of the parabola to get the focal distance (p) and hence the required point.
In general, the equation for a parabola with vertical axis is
`x^2 = 4py.`
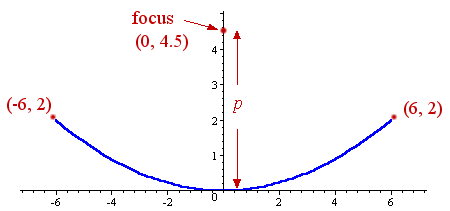
We can see that the parabola passes through the point `(6, 2)`.
Substituting, we have:
`(6)^2 = 4p(2)`
So `p = 36/8 = 4.5`
So we need to place the receiver 4.5 metres from the vertex, along the axis of symmetry of the parabola.
The equation of the parabola is:
`x^2 = 18y `
That is
`y = x^2 /18`
Application 2 - Projectiles
A golf ball is dropped and a regular strobe light illustrates its motion as follows...
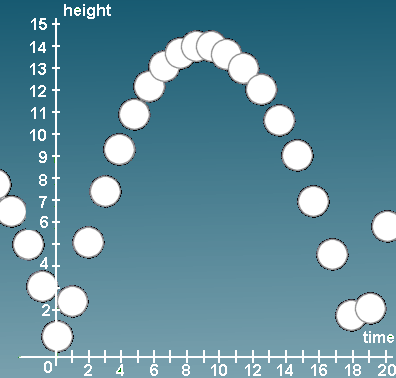
We observe that it is a parabola. (Well, very close).
What is the equation of the parabola that the golf ball is tracing out?
Answer
First we get a set of data points from observing the height of the ball at various times from the graph (I've used the bottom of each circle as the data point):
| t | 0 | 2 | 4 | 6 | 8 | 10 | 12 | 14 | 16 |
|---|---|---|---|---|---|---|---|---|---|
| h | 0.2 | 4.3 | 8.2 | 10.9 | 12.3 | 12.5 | 11.6 | 9.5 | 6.0 |
Using Scientific Notebook, we can model the motion from the data points.
Using one of the Statistics tools in Scientific Notebook (Fit Curve to Data), we obtain:
`y = -0.51429 + 2.804x - 0.15013x^2`
Here's the graph of the model we just found:
Parabolic golf ball motion.
We can use this to find where the ball will be at any time during the motion. For example, when t = 2.5, the golf ball will have height 5.6 m. Also, we can predict when it will next bounce (at around time `18.5`), by solving for `y = 0`.
Using Excel to Model Curves
You can also use Microsoft Excel to module a parabola. After you plot the points, right-click on one of the points and choose "Add Trendline".
Choose Polynomial, degree 2. In "Options" you can get Excel to display the equation of the parabola on the chart.
Conic section: Parabola
All of the graphs in this chapter are examples of conic sections. This means we can obtain each shape by slicing a cone at different angles.
How can we obtain a parabola from slicing a cone?
We start with a double cone (2 right circular cones placed apex to apex):

If we slice a cone parallel to the slant edge of the cone, the resulting shape is a parabola, as shown.