Search IntMath
Close

450+ Math Lessons written by Math Professors and Teachers

5 Million+ Students Helped Each Year

1200+ Articles Written by Math Educators and Enthusiasts

Simplifying and Teaching Math for Over 23 Years

Tips, tricks, lessons, and tutoring to help reduce test anxiety and move to the top of the class.

Interactive 3-D conic sections graph

By Murray Bourne, 10 Mar 2012

Interactive 3D conic graph

I recently added the following 3D interactive graph page to the Plane Analytic Geometry chapter in IntMath.

Interactive 3-D conic graph

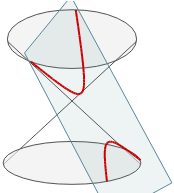
A "conic" curve is what you get when you slice a double cone by a plane, at different angles.

For example, a horizontal slice gives us a circle, and if we change the angle of the intersection plane slightly, we'll get an ellipse.

You can explore how to obtain a parabola and a hyperbola as well. This would work well with an Interactive White Board.

The link again: Interactive 3-D conic graph

Be the first to comment below.

Leave a comment


Comment Preview

HTML: You can use simple tags like <b>, <a href="...">, etc.

To enter math, you can can either:

  1. Use simple calculator-like input in the following format (surround your math in backticks, or qq on tablet or phone):
    `a^2 = sqrt(b^2 + c^2)`
    (See more on ASCIIMath syntax); or
  2. Use simple LaTeX in the following format. Surround your math with \( and \).
    \( \int g dx = \sqrt{\frac{a}{b}} \)
    (This is standard simple LaTeX.)

NOTE: You can mix both types of math entry in your comment.

top

Tips, tricks, lessons, and tutoring to help reduce test anxiety and move to the top of the class.