Online graph plotter using JSXGraph
By Murray Bourne, 03 Jun 2011
JSXGraph allows you to plot mathematical functions on any browser, and on any operating system.
You can now plot your own graphs using this online graphing calculator:
Plot your own graphs using JSXGraph
You can input many different functions, including:
- Straight lines and parabolas
- Trigonometric functions and their inverses
- Exponential and log functions, including base 10
- Hyperbolic functions
This JSXGraph plotter has similar functionality to my SVG-based plotter, but works in more browsers and systems.
JSXGraph works on iPhone and Android, too!
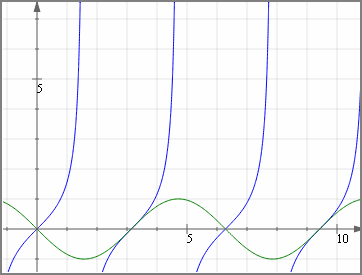
Here's a screen shot:
Try it out and let me know if you have suggestions for improvement. The link again:
Plot your own graphs using JSXGraph
See the 2 Comments below.

7 Jun 2011 at 10:56 pm [Comment permalink]
Where can I JXgraph software
8 Jun 2011 at 8:37 pm [Comment permalink]
@asoros: Full information on JSXGraph can be found here: http://jsxgraph.uni-bayreuth.de/wp/