CrazyEgg Web Analytics
By Murray Bourne, 02 Nov 2007
Web analytics is fascinating. What do site visitors do? How long do they stay? Where do they go next? Do they go where the Web designer intended?
I love the rich information given by Google Analytics. However, CrazyEgg adds extra insights into user behaviour.
I used CrazyEgg on the homepage of my Interactive Mathematics recently. There were just over 600 visits in the trial, and the following screenshots give you an idea of what CrazyEgg can do.
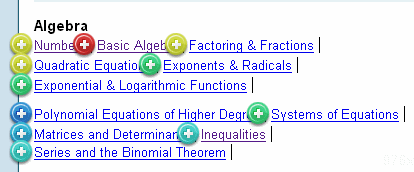
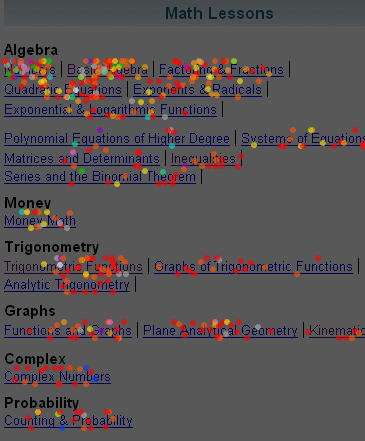
In this shot, the colors of each button indicate number of clicks (red is most active, followed by yellow):
The following chart indicates the time spent on the homepage. The ones who chose where to go within 0.5 of a second (!) were probably repeat visitors and knew where they wanted to go. At the other end of the scale, the ones who stayed more than 30 minutes were probably using multiple tabs on their browser and were on other sites (or heck, maybe they just went to have a coffee...)
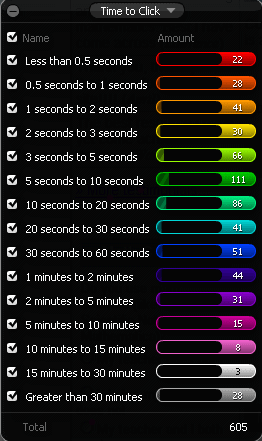
The table above is the legend for the following 'confetti view'. The 'peckers' (rapid fire users) appear to be headed for the Graphs of Trigonometric Functions, while the more relaxed users tended to choose the Complex Numbers or Probability links.
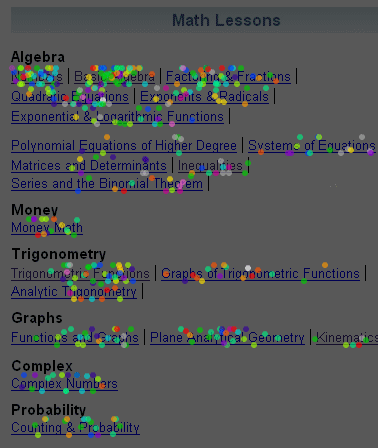
CrazyEgg allows you to choose any one of the confetti dots and get a lot more information on that specific visitor.
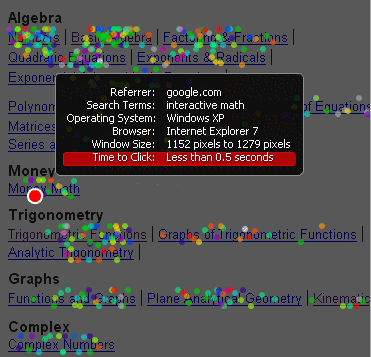
The next view shows in red those who came directly to the site (either by typing in the URL or via a browser bookmark). The other colors indicate other sources (referrals from other sites or search engines):
Heat Maps
Now for the really awesome stuff. While Google Analytics has a display overlay that lets you see how many clicks there are for each destination, such information is not available for each particular link. But there may be more than one link on the homepage going to another specific page. Which link performs best?
The CrazyEgg heat map shows numbers of clicks on different parts of the screen, using color coding. The brighter the color, well, you get the idea:
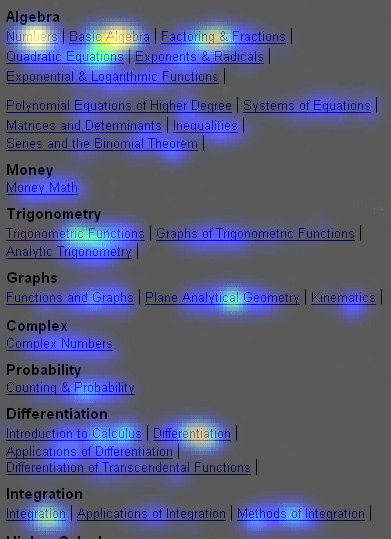
The link to my Population page got some action:

The "sitemap" link at the bottom of the page got more hits than the "sitemap" link at the top of the page. This is probably not that surprising considering that someone will need the sitemap if they didn't find what they expected after scrolling down the page.

The heat map script is clever, since it allows for different screen resolutions and font size settings.
It's not as good as Nielsen's eye tracking heat maps, since it only gives an indication of clicks, not eye fixations. I would love to be able to overlay the 2 heatmaps - now that would tell you a lot.
There is a free version of CrazyEgg that allows you to analyze 5000 visits per month. It's a good deal.
Does any of this matter?
It is a consistent finding across the Web that around half of users leave a page without clicking any links on that page. (See Zipf Distributions, log-log graphs and Site Statistics.) Most Webmasters (and blog writers, YouTube creators, etc) aim to achieve a 'sticky' site that keeps visitors coming back for more. Analytics helps to achieve this.
Sites like Google, Amazon, Yahoo, Facebook, MySpace command billion dollar valuations. What visitors do on such sites, where they come from, how long they stay and what they do next are all vital pieces of data. Virtual worlds like Second Life keep terabytes of data on user behavior, including times, dates, conversations, locations, etc. It's all about maximising revenues, of course.
In the pre-Web past, advertisers could never effectively track the effectiveness of an ad campaign. Now, with analytics such as Google's and CrazyEgg's, there is a way to use their advertising spend much more efficiently. No wonder print and TV ad revenues are dropping.
e-Learning Effectiveness
I have a particular interest in measuring the effectiveness of e-learning. Do students use the e-learning materials in the way the lecturer designed them? How does multimedia perform? How long do students stay on a particular page (one hopes they read what they are supposed to read)? Do they navigate to where they are supposed to navigate? What really happens in discussion forums? At what point do they give up and just go to Google to figure out the answer?
Institutions should be using Google Analytics and CrazyEgg to increase the effectiveness of e-learning design.
They are watching us
Some people get very concerned about privacy issues when it comes to Web analysis. It never worries me. If someone is interested in improving the appalling state of many Websites out there (poor navigation, difficult to read, inappropriate Flash, long page loads, bad use of iframes), I'm all for it.
But then again, maybe the day of Big Brother has arrived...
See the 1 Comment below.
3 Nov 2007 at 2:30 pm [Comment permalink]
Ok, you've got me curious about where people go on my blog (wildaboutmath.com). I've just set up a free account with CrazyEgg and found a WordPress plugin that would insert the javascript code properly at [resource no longer available].
I'll report back on what I discover!
Thanks,
Sol