Polar coordinates and cardioid microphones
By Murray Bourne, 18 Oct 2009
Polar coordinates provide us with an alternative way of plotting points and drawing graphs. You can express complicated graphs using simple polar functions. One of the applications of polar graphs is to describe the characteristics of microphones.
Polar graphs are quite different to those we produce using our familiar Cartesian coordinate system (the familiar x-y axes).
In the polar coordinate axis system, the point (r, θ) is defined as follows. Along the (horizontal) polar axis, go out r units, then rotate in a positive direction (anti-clockwise) about the pole by an amount θ. This is shown in the following diagram.
Example: The point (7, 120°) in polar coordinates is plotted below. We go 7 units out the polar axis, then rotate around the pole by 120°.
We normally use polar graph paper to plot such points. Here is the same point (7, 120°) plotted on a polar graph grid:
Curve Drawing in Polar Coordinates
Example: Let's draw the curve r = sin θ using polar coordinates.
If θ = 0°, then r = sin 0° = 0. So the starting point is (0, 0°). [Note: In polar coordinates, the point (0, 0°) means the distance from the origin is 0 and the angle θ is 0°.]
Let's now choose angle θ = 30°. For this point, we need to move out r = sin 30° = 0.5 from the origin, then rotate 30°.
For a 3rd point on our graph, we choose θ = 45°. For this point, we need to move out r = sin 45° = 0.7071 from the origin, then rotate 45°.
Choosing another point θ = 80°, we need to move out r = sin 80° = 0.9848 from the origin and rotate 80°.
Here are the 4 points we have considered so far:
| θ | 0° | 30° | 45° | 80° |
|---|---|---|---|---|
| r = sin θ | 0 | 0.5 | 0.7071 | 0.9848 |
The graph of those 4 points is as follows:
We continue adding points and obtain the following values in the table:
| θ | 90° | 120° | 135° | 170° | 180° |
|---|---|---|---|---|---|
| r = sin θ | 1 | 0.8660 | 0.7071 | 0.1736 | 0 |
Graphing all the points found so far gives the following (in red), with some other points added (in blue, obtained by substitution):
Joining all the points, we get the following circle:
We can easily graph some interesting shapes using polar coordinates, as follows. (These can become very complicated and ugly if we use the normal x-y coordinate system.)
Cardioid
The following cardioid is the graph of the function r = 1 − sin θ. This time the start point for the graph is at (1, 0°) (which is at 1 on the horizontal polar axis) and the curve is generated from there in an anti-clockwise direction.
It is called a cardioid because it is heart-shaped.
Flower
This is the graph of r = sin 4θ. The result looks like the petals of a flower.
Echidna
The shape of this one reminds me of the echidna (the Australian spiny anteater that rolls itself up into a ball when threatened). The function involved is: r = sin 44θ − 2 cos θ
You can find more information and examples about polar coordinates in this introduction to Polar Coordinates. You can also print your own polar graph paper (in PDF form).
Polar Graphs and Microphones
Different microphones have different recording patterns depending on their purpose.
a. Omni-directional Microphone: This microphone is used when we want to record sound from all directions (for example, for a choir).
The recording pattern is almost circular and would correspond to the polar curve r = sin θ that we met above.
Omni-directional microphone [Image source: ALDS]
The following diagram shows a real recording pattern for an omni-directional microphone, graphed on polar graph paper. The different curves are for different frequencies, and the placement of the microphone is at the center of the circle. At low frequencies the pattern is almost circular, but at higher frequencies it becomes less so and more erratic.
Image source: dpamicrophones
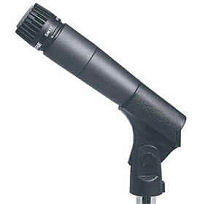
b. Cardioid Microphone: This is a uni-directional microphone, which means we only want to pick up sounds from in front (one direction). The recording pattern is a cardioid, which we met above. In the following image, I have used the graph of r = 1 + sin θ. (There is some "spill", where sounds immediately behind the microphone are also detected.)
Cardioid microphone [image source]
c. Shotgun Microphone: This is a "super-directional" mike, where we only want to pick up sounds from directly in front of the mike. The graph used for this example is r = θ2.
Shotgun microphone [image source]
d. Bi-directional Microphone: This is used in an interview situation, where we want to pick up the voices of the interviewer and the person being interviewd.
Bi-directional microphone image: source
So next time you see a microphone (in your mobile phone, notebook computer, in a recording studio or wherever), remember that the shape of its recording pattern is an interesting application of graphs using polar coordinates!
See the 22 Comments below.
19 Oct 2009 at 8:12 pm [Comment permalink]
That is so cooool!!!
20 Oct 2009 at 4:32 pm [Comment permalink]
Could this approach help me understand what is going wrong in a meeting hall I attend. When one speaker is talking from
the platform I hear everything he says clearly through the
loop setting on my digital hearing aids. When roving mikes
are used for audience discussion or platform dual speakers
my loop performance is very intermitent. As none of the volunteer sound engineers are deaf they have very little understanding of the problem.
20 Oct 2009 at 4:34 pm [Comment permalink]
concerning microphones, yes, the polar co-ordinates hold true. I am thinking if it is applicable to antennas, speakers and receivers.
20 Oct 2009 at 4:59 pm [Comment permalink]
James: Perhaps it is the type of microphone they are using. If it is too directional, it means the signal will be poor unless the speaker is standing right in front of it.
But what you describe sounds a bit more like interference is occurring, rather than poor microphones.
Any experts out there with some insights?
20 Oct 2009 at 7:26 pm [Comment permalink]
thanx sir u for sending me this newsletter and complete info about the cardioid microphone i studied this and i understand all the points thanx
i shall be waiting something new more
thanx
20 Oct 2009 at 11:42 pm [Comment permalink]
So cool! Never thought about how mics work before !!!
21 Oct 2009 at 1:15 pm [Comment permalink]
tell me the applications of hyperbolic functions, elliptic path, parabolic path and related topics...
22 Oct 2009 at 12:53 am [Comment permalink]
we studied polar graphs in unversity .. but I was shocked when I found the relation between them and microphons..
That was intersting..
thanks to you M. bourne.
Best regards
22 Oct 2009 at 12:58 am [Comment permalink]
this is amaizing to 4 me to learn the microphone plotting and polar form am almost becoming agreat mathematician because your am ready to learn more and recieve more from you may be at the end of each topic you send i would like you to add for me or us some questions thank you may god bless you
5 Nov 2009 at 10:34 pm [Comment permalink]
Thank you about this knowldge.
11 Nov 2009 at 8:48 pm [Comment permalink]
i haven't been imagining maths to be a real life application. you are giving the best!
1 Jun 2010 at 10:58 am [Comment permalink]
Thanks! I needed this info for a math project. That was a lot of help
27 Feb 2011 at 10:19 am [Comment permalink]
When it comes to your problem, James, polar coordination will not help understand what is going on. Most likely there is a electromagnetic switch on the polarity of the microphones and/or the latter of the stereo speakers. Because of this there is a cancellation of signal which human ears are often not affected by unless it is times very perfectly. However, microphones in a hearing aid may not be so fortunate and, relying on a different compilation of vibration and/or air pressure formed waves, they may experience the cancellation. Just a theory- info am not a professional by degree but I do hold expirience in the field via studio, concert, and theoretic/mathematics work. I also apologize for any spelling and grammar errors as I typed this on my phone.
11 Apr 2011 at 12:28 pm [Comment permalink]
This is what I am learning now in my course. The explainations and procedures here are simple for me to understand and follow at my own pace.... I like it!!!!!
11 Apr 2011 at 8:45 pm [Comment permalink]
Hi Cruzplato - glad you find IntMath.com helpful!
12 Feb 2012 at 4:08 pm [Comment permalink]
nice explaination by using mic
14 Feb 2014 at 5:15 am [Comment permalink]
Motivated by your discussion about the echidna durve, I've made a video about my take on a variant of that curve and equation.
https://www.youtube.com/watch?v=wJ7xxBU_kgQ
15 Feb 2014 at 3:42 pm [Comment permalink]
Thanks for sharing, Chris!
18 May 2014 at 4:57 am [Comment permalink]
[…] approach towards how microphones pick up, detect and cancel out sounds. We really like this article explaining polar patterns of mics, but we sum up the basics of it in 1-2 sentences for you. The most widely used type of mic is […]
21 May 2016 at 3:31 pm [Comment permalink]
Very interesting... Never expected relating polar graphs with mikes...
5 Aug 2016 at 1:28 am [Comment permalink]
An omnidirectional microphone would correspond to a polar function of r = 1. Your circular equation, r = sin(θ), for an omni mic would neglect sound from negative y positions, and, therefore, not be an omni mic.
This is otherwise a great explanation of real world polar function examples. Thanks for sharing!
5 Aug 2016 at 10:03 am [Comment permalink]
@Noble - it depends on the placement of the microphone in the resulting circle. As shown by the image in that section, the microphone is placed at (0, 0.5) (using Cartesian coordinates). Yes, we could also think of it as r = 1, adn place the microphone at (0, 0). Same result.