New applet: What does b do in a quadratic function?
By Murray Bourne, 30 Jun 2017
The parabola is one of the most common curves we come across in engineering and science, as it is often an appropriate choice for modelling portions of curves because of its simplicity.
We've seen elsewhere how to Draw the Graph of a Quadratic Equation (a parabola), and about Parabolas with Vertical and Horizontal Axes. Moving in the reverse direction, we learned how to Find the equation of a quadratic function from its graph.
In this new applet, we learn the effects of changing each of the a, b and c variables in the quadratic form of a parabloa,
y = ax2 + bx + c
Changing a and c
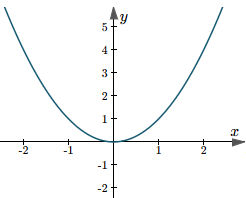
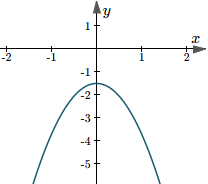
Changing variables a and c are quite easy to understand, as you'll discover in the applet. You'll see something like the following as you move the sliders:
Changing b
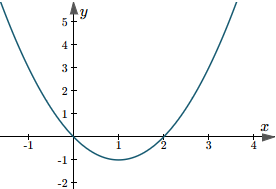
The effect of changing variable b is not so clear. The original curve seems to move around a new curve. What is that new curve and how much does the original curve move by?
The new applet
Time to check out the applet at:
Interactive Quadratic Function Graph
See the 3 Comments below.
30 Aug 2018 at 6:37 am [Comment permalink]
If you take the derivative of a function, the value of x=0 of the derivative will always be b.
If you don't know what derivatives are, here is a youtube video explaining them. They are basically the slope of a function at each point, or, for quadratics, the tangent to the quadratic at point x.
the derivative for ax^2+bx+c is 2ax+b
When x is zero, then the slope is b.
30 Aug 2018 at 9:39 am [Comment permalink]
@Zane: Your first sentence is misleading. That is only the case for a limited type of function, not all functions.
19 Jul 2020 at 1:05 pm [Comment permalink]
When change the b as the vertex move about and rotate through 180 degrees becomes inverted.This information is very important as -2b/a concept as half of sum of the root and Quadratic equations root may be obtained from (-2b/a -1) (-2b/a +1) = c/2 finding a new solution.
Apply if in any quadratic equation to find a solution.