New 3D interactive graph
By Murray Bourne, 13 Apr 2016
Most students struggle when trying to understand 3D cartesian coordinates, especially when diagrams in text books are static, and in 2 dimensions only (of course).
I recently published a new 3D cartesian coordinates interactive graph:
In the introduction to 3D graphs, I gave the example of the point P (2, 3, 5) . The 3D interactive graph allows you to explore what a point in 3 dimensions means and helps to orientate those unfamiliar with the xyz-coordinate system.
You can vary the x-, y- and z-coordinate of the given point and rotate the axes, as well as zoom in and out.
This is quite a simple interactive and I hope to introduce more involved ones in the coming months.
I developed the applet using Three.js, a 3D javascript library. As such, the applet is cross-platform, cross-browser and mobile friendly.
xyz axes orientation?
When I first wrote the section on 3D Space in the Vectors chapter, I wanted to ensure I chose a "good" orientation for the 3 axes. By "good", I mean that I was using a proper convention and that it was commonly used.
For interest, I looked at what Google Images returned for a search on xyz axes. I'm using the results of that search below.
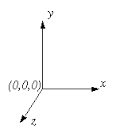
When I first learned 3D geometry in secondary school, we started with the familiar xy-axes and drew the new z-axis coming "out of the page" towards us, like this (let's call it Orientation #1):
At times we would see the axes rotated around the y-axis, like this one (let's call it Orientation #2):
But that was OK - the y-axis was still at the top, so we didn't get lost.
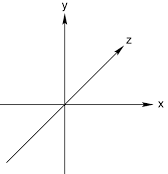
When I met the idea again at university, the following convention was used. The z-axis was vertical, with the x-axis going to the left (and down-ish), and the y-axis going to the right (also down-ish), like this:
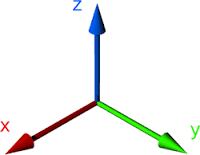
This change of orientation was quite disconcerting at first. I kept drawing points, planes and graphs the wrong way round.
Now I'm more used to this orientation (let's call it Orientation #3) , and it seems that it's more common to have the z-axis going up.
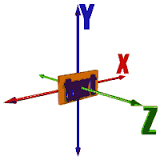
You'll also see it with the x- and y-axes rotate 90°, like this (let's call it Orientation #4):
Right-hand Rule
Each of the above orientations obeys the right hand rule, whereby if our right-hand index finger points in the direction of the x-axis, and our second finger points in the direction of the y-axis, then our thumb will point to the z-index.
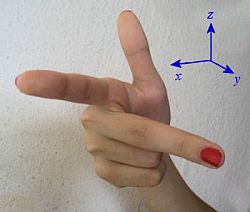
(Yes, you have to contort your hand around somewhat to ensure each of the above orientations work, but they do.)
The following one (found in Google's index of such axes) fails the right-hand rule:
(To be fair, it is possible the z-axis is coming out of the page towards us, but that's not the impression I get.)
Is a vertical z-axis more common?
The calculus text books by Kreyszig, Washington, Mizrahi/Sullivan and Thomas/Finney all use Orientation #3, which is why I used that orientation as well.
Wolfram Alpha's default 3D view is the same as Orientation #4 (where the positive x-axis is to the right and down, and the y-axis is to the right and up.)
Here's the curve z = x2 + sin(y) by Wolfram|Alpha:
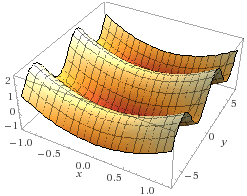
Geogebra has the same default orientation. Here's the same graph using Geogebra, which doesn't appear to have an option for naming the axes (it does for 2D axes).
Up next is Scientific Notebook, which uses x to the right and down, and y-axis to the left and down, with z up.
This means it fails the right hand rule! At least the axes are labelled.
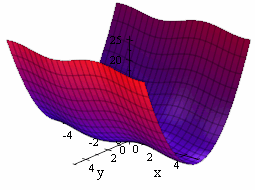
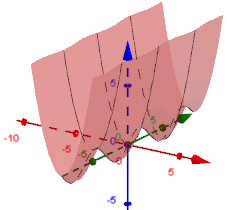
Matlab's plot on first glance appears to be the same as Wolfram|Alpha's, but in fact, the positive y-axis is going off to the left and up.
It obeys the right hand rule, but this is not a common orientation.
Why does it matter?
As I mentioned earlier, a lot of novice learners have difficulty imagining planes and other surfaces in 3D. Presenting graphs in a myriad of orientations doesn't help.
Suggestions for teachers
- The first examples of 3D graphs that students see should use a consistent orientation, as far as possible (of course, we need to turn things around a bit to see key features, but keep such turns minimal)
- Slowly introduce other orientations, and point out clearly the features of the new orientation and why you are using it
- Always label the axes and insist students do so as well. If you are using one orientation, and they understand it to be another, confusion is sure to follow
- Eventually give examples of all the possible 3D axes orientations, so students can figure out the differences.
The link to the interactive graph again:
Be the first to comment below.