svgPHPGrapher - a new math plotter
By Murray Bourne, 29 Sep 2015
Over the last few weeks I've been developing a new math plotter. It produces an svg image server-side using PHP.
The motivation
The graphs on IntMath were produced over a number of years using a range of different software, and were starting to look rather dated. Most of the curves were pixelated, and I'd used a motley range of clashing colors.
For the last few years I've been using JSXGraph to produce interactive graphs (see plenty of examples here). JSXGraph gives nice SVG output and it's cross-browser.
However, the problem with JSXGraph is it involves a large footprint (167 kB of script, even after compression by gzip), which is a killer for mobile devices, especially if you just want to plot a simple graph on your Web page. Yes, the js file is cached by the browser, but a lot of first-time users will hit the back button rather than waiting for a large download.
Another issue is there is already too much javascript on my pages (and on the Web generally). A typical IntMath page involves:
- jQuery for a lot of interaction (92 kB compressed);
- KaTeX (34 kB) or MathJax (160 kB) for displaying mathematics (I mostly use KaTeX these days);
- Google ads pull in a whole lot more javascript (it varies on each page, but 400 kB is common).
- Google Analytics (for optimizing the site, about 18 kB)
All that javascript means a lot to download (more than 50% of the total download for most pages) and puts a load on your device's processor, especially noticeable when viewed on mobile devices. I try to have the minimum amount of javascript on the site (particularly the mobile version), to reduce page load times and processor overhead, but it's a challenge.
Another issue is that most of the graphs on IntMath don't need to be interactive. The purpose of many of the graphs is to illustrate a concept, or to show main features of a function. So there's no need for a large chunk of javascript, designed for interactivity, just to show a static graph.
The grapher brief
My aim was to produce a grapher with the following characteristics:
- Small page load time
- Not javascript based
- All the grunt work would be done on the server (not the client device)
- Produced good looking graphs
- Displays axis variables (How often did your math teach tell you to "label your axes"? Most graphing software does not include this feature.)
- Relatively easy to use
Enter svgPHPGrapher...
svgPHPGrapher
svgPHPGrapher is based on Peter Jipsen's ASCIIsvg.js, which is a javascript-based SVG (scalable vector graphics) grapher. When he first published this script (around 2005), svg support in browsers was very rudimentary (IE didn't support it at all, of course), so it couldn't be reliably used. But now, all major browsers support svg, including those on mobile devices.
svgPHPGrapher is a highly modificed PHP port of the ASCIIsvg javascript codebase.
The idea is that some PHP code on your PHP page calls some functions, which create an svg-based image, and it's then printed out to the page. The processing "work" is done on the server, and immediately output. This creates a slightly larger HTML page, but there is no separate file to download, and no javascript involved.
There is also the option to cache graphs, so if they take a lot of processing time. it needs to only happen once (by the first visitor) and subsequent visitors will see the cached svg image.
What is SVG?
SVG stands for "scalable vector graphics" and it's a method for producing crisp, good looking images at any resolution. Older image formats like GIF, PNG and JPEG are made up of a collection of colored pixels in fixed positions. When you zoom in on such images, you see pixelated edges. But in the case of SVG images, the edges remain crisp. (This is desirable in this age of mobile devices with retina screens, and the requirement to produce scalable images for different screen sizes.)
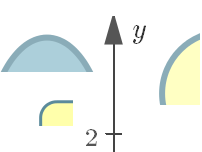
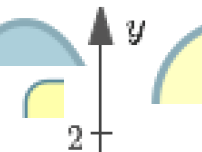
For example, here are screen shots from a zoomed-in SVG image (on the left), where you can see the fonts and curves are smooth and attractive, while the one on the right is a zoomed in PNG image of the same subject matter. You can see the shape edges are quite ugly, and the fonts are no better.
SVG allows you to describe an image mathematically. For example, an ellipse is created using:
<ellipse stroke="#165a71" stroke-width="3" fill="#5a9fb5" opacity="0.5" cx = "77.222" cy = "153" rx = "31" ry = "62" ></ellipse>
The first part includes instructions for colors of edges and the inside (fill), and the last parts describe the center of the ellipse and how far the ellipse extends in the x- and y- directions.
By defining shapes in this way, the resulting file size is smaller than a PNG or GIF, and takes less download time.
Examples
Here are some example output graphs. They are real SVG images (not screen shots). You can zoom in on them to see the crisp edges I was talking about above.
Function Graphs
Here's a plot of the hyperbolic cosine function y = cosh (x) . (A catenary is the shape traced out by a chain or a rope hanging from 2 fixed points.)
Geometric Shapes
Here are some of the possible geometric shapes:
Parametric Curve
This is the curve x = t cos (t), y = t sin (t) from −7π/2 < t < 7π/2.
Syntax, download and more examples
You can try out svgPHPGrapher yourself, if you like. You can find a download link, syntax for using the grapher, and many more examples on this page:
You'll just need a PHP-based server (on your local machine, EasyPHP is recommended, or a real server) and a browser. Let me know how you go with it. I hope you find it useful.
See the 2 Comments below.
5 Oct 2015 at 2:19 pm [Comment permalink]
Sites with a lot of traffic face the problem that you need a lot of power to run the scripting; at least if more complex functions are involved. Moreover, for these more complex plots, the SVG data tends to exceed the code necessary to create it. So you get more traffic, not less.
As a side remark, SVG is not the answer to scaling as many seem to think. Scaling is done with different font sizes, line widths, textures, point sizes, even different layouts for different print or display sizes. This can be handled much better by interactive plots, if the graphics is resizable on the page. Sorry about this remark, but I often hear this misconception about SVG and other vector formats.
5 Oct 2015 at 5:35 pm [Comment permalink]
@Rene: Thanks for your comment.
(1) As for power to run the scripting, it's always much better to do that on the server, than on the client machine, especially when targeting mobile devices.
(2) My system allows for caching, so it only needs to be created once. (I'm still perfecting this, but it's close.)
(3) Each of the cached files is small (largest out of all my examples so far is about 8 kB. The size of the PHP code is irrelevant (and not that big anyway - a lot smaller than JSXGraph, for example), because it is cached on the server.
(4) I'm still experimenting, but I believe that my statement about changing resolutions is valid.
I put together an experiment page:
https://www.intmath.com/cg3/svg-resolutions.php
The different size SVG graphs look a lot better than the comparison PNG image when it is resized. I'm not sure that having large globs of javascript helps here.
I appreciate your interest!