IntMath Newsletter: Sampling, svgPHPGrapher
By Murray Bourne, 30 Sep 2015
30 Sep 2015
In this Newsletter:
1. Sampling
2. Resource: svgPHPGrapher
3. Application of hyperbolic decay
4. Math puzzle
5. Math movie: Jim Simons
6. Final thought: Haze
1. Sampling to produce mathematical function graphs
I've been developing a new graphing system for IntMath (see the following article on svgPHPGrapher).
It's been an interesting challenge and I've learned a lot doing it. One of the issues I constantly grappled with was that of sampling. To produce a smooth curve that goes to the edge of the graph boundaries (especially when it involves discontinuities), you need to sample a sufficient number of points. But if you take too many, it takes too long for the computer to create the graph, and ends up inflating the size of the graph file.
I thought while doing this that there are a lot of parallels with the way students learn how to sketch graphs. The age-old technique of drawing up a table, substituting in some values, putting dots on the graph paper and then joining them with a curve is not always a good idea, since it can trap those who aren't careful, or who don't have a sense of what the graph should look like in the first place.
This article is about sampling, and includes a bunch of examples of the new graphs I've been developing.
While I obviously believe students should use computers to draw graphs, it's important even then to have a sense of what it should look like first.
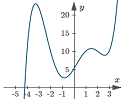 |
When sketching mathematical functions on paper or computers, it's a good idea to have a sense of what the general shape of the curve is before you start. Sampling can lead to erroneous results. |
2. Resource: svgPHPGrapher - a new math plotter
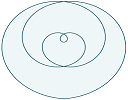 |
svgPHPGrapher produces clean math graphs with no javascript, and all the processing happens on the server. This article also talks about SVG - a mathematical approach to crisp images. |
You may also find the syntax example page interesting (not necessarily for the syntax, but for the graphs on the page). Here's the link to the syntax examples page:
3. Application of hyperbolic decay
A few months back I wrote an article about Hyperbolic and Exponential Discounting. A reader kindly sent me a journal article that describes an application of hyperbolic decay, involving capacitors.
Almost all electronic devices contain capacitors, which have the ability to hold an electrical charge for a short time.
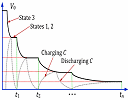 |
The article talks about the case where the capacitor is charged for a period of time, then discharged, then charged again in a pattern that resembles the hyperbolic decay graph. Here's the paper: On hyperbolic laws of capacitor discharge through self-timed digital loads |
4. Math puzzles
The puzzle in the last IntMath Newsletter asked about cards on a table.
Correct answers with explanation for the main question were given by: Henry, Isabel, Tomas, and Don. For the bonus question, kudos to Henry, Isabel, Don, Tomas, and Pritesh.
As usual, it was interesting to observe the very different approaches each of you took.
New math puzzle
In the set of digits below, you need to circle 6 of them that sum together to give 21.
1 1 1
3 3 3
5 5 5
9 9 9
You can leave your responses here.
5. Math movie - Jim Simons: The mathematician who cracked Wall Street
There's several things in this video that made me uncomfortable (he sees little ethical dilemma in the hedge fund industry siphoning off the best and brightest, or in living much of his life with the main aim of making mountains of money), but he redeems himself at the end with his philanthropic work.
 |
It's a long interview, but gives an interesting insight into a mathematician who has had a broad range of experiences. Go to: Jim Simons: A rare interview with the mathematician who cracked Wall Street |
6. Final thought: Haze

It's that time of the year in SE Asia when millions of people (including me) suffer due to the smoke and haze created by burning forests for paper and palm oil. Spare a thought for the Indonesian villagers nearby the fires, who at times are faced with a PSI (Pollutant Standards Index) of 2000+, when anything over 100 is considered unhealthy. Such pollutant indices include factors such as the concentration of 2.5 μ (micron) fine particles - the ones that can easily pass through your cell walls.
You can see hourly PSI trend graphs for Singapore here: PSI Trend Graphs
Come on, Indonesian farmers - show some responsibility for the environment, for your own people, and for the vast number of people who are really suffering due to your "cash before life" approach.
Until next time, enjoy whatever you learn.
See the 23 Comments below.
30 Sep 2015 at 11:23 am [Comment permalink]
possible solution is 11+1+3+3+3 = 21 otherwise How can sum of six odd number is even then it is impossible with only addition operator...Regards Sachin
30 Sep 2015 at 12:12 pm [Comment permalink]
It is the sum of six (six is an even number) odd numbers, so the result will be an even number. No solution. Their sum will be the even number rather odd as 21
30 Sep 2015 at 1:36 pm [Comment permalink]
circle 1 digits 11
circle 2 digit 1
circle 3,4,5 digit 3 digit 3 digit 3
I have circled 6 digits and the sum 11 + 1 +3 +3 +3 = 21
note: 6 single odd digits when summed give an even integer
21 is odd This leads tio "11"
30 Sep 2015 at 2:54 pm [Comment permalink]
The puzzles answer is 1 1 1 3 5 5 = 21
30 Sep 2015 at 6:14 pm [Comment permalink]
Odd number/numbers when added even times always result in a even number. 1,3,5,9 (given numbers are all odd) add 6 numbers(even ) cannot result in 21(odd number).
So no matter whatever the options are result can never be 21. Result can only be 21 if we add odd number of numbers.
30 Sep 2015 at 9:44 pm [Comment permalink]
1+1+1+3+3+3+9=21
30 Sep 2015 at 10:38 pm [Comment permalink]
1 1 1
3
5 5 5
sum 6 = 21
1 Oct 2015 at 1:20 am [Comment permalink]
Adding an even number of odd numbers cannot yield an odd number
1 Oct 2015 at 1:30 am [Comment permalink]
This problem is solved by constructing the complete set of choices of six out of the 12 digits available, and then looking at the sum of the six elements in each case. There are 924 possible selections , i.e., 12!/(6! 6!), or just 44 if one gathers all the cases which have the same elements in different order, and none of them has 21 as the sum of its six elements. Hence the problem has no solution.
If one writes nums = {9, 9, 9, 5, 5, 5, 3, 3, 3, 1, 1, 1}, then the procedure can be coded in Mathematica as follows:
Select[Subsets[nums, {6}], Total[#] == 21 &] and this results in an empty list. Actually, the set of all the sums which may be obtained from each of the 924 possible selections is
{12, 14, 16, 18, 20, 22, 24, 26, 28, 30, 32, 34, 36, 38, 40, 42}
and 21 is not one of them.
1 Oct 2015 at 1:49 am [Comment permalink]
Adding an even number of odd numbers cannot yield an odd number. The trick is to have an odd number of circles and bend the rules and definitions our fine English language:
11 plus 1 is 12
Plus all three 3s
Voilà! 21
1 Oct 2015 at 6:06 am [Comment permalink]
5533311
1 Oct 2015 at 6:12 am [Comment permalink]
Circle 2 of the 1's together representing 11
Circle the remaining 1
Circle each of three's independently
Yielding:
11 + 1 + 3 + 3 + 3 = 21
5 circles, but 6 digits involved.
1 Oct 2015 at 9:40 am [Comment permalink]
Turn the set of digits upside down.
Circle each of the three sixes that now appear at the top of the set.
Circle each of the three ones that now appear at the bottom of the set.
Then 6+6+6+1+1+1 = 21
1 Oct 2015 at 10:27 am [Comment permalink]
I can't really think of the answer in the new math puzzle. It said to be that we need to encircle 6 numbers in the set of numbers wherein the sum of them gives the answer of 21. I try 9,5,3,3,1 but it's just five numbers that gives the result of 21. When i encircle again the number 1, it will become 22 so my answer is wrong. My other guess is 5,5,5,3,1,1,1 the answer is 21 but it's seven digit. My conclusion is that there is no answer in this puzzle. Am i right?? Sorry i'm not a genius I can't just really think of the right answer 🙂
1 Oct 2015 at 10:50 am [Comment permalink]
Can not be done
1 Oct 2015 at 7:08 pm [Comment permalink]
No solution. The sum of any two odd numbers results in an even number. The sum of any two even numbers results in another even number. Since there are six odd addends, the sum will always be an even number.
2 Oct 2015 at 5:55 am [Comment permalink]
We circle the ones and the nines, then we turn the page upside down and...they sum 21!! (6 x 3 + 3 x 1 = 21)
3 Oct 2015 at 5:07 am [Comment permalink]
An odd-even argument shows that it cannot be done.
9 Oct 2015 at 11:21 am [Comment permalink]
We want the SUM of any six ODD numbers to give 21. However, any EVEN group of ODD numbers such as six will only give an EVEN answer! Hence 21 as an answer cannot be achieved with the given combination of ODD numbers!
21 Oct 2015 at 2:35 am [Comment permalink]
I noticed that the "9" Could be classed as a "6" so I used 6,5,3,3,3,1 six numbers that make 21.
31 Oct 2015 at 3:19 am [Comment permalink]
9+1+9+1+1
this is the solution
9 Nov 2015 at 8:06 am [Comment permalink]
Circle 5, the middle one.
28 Jun 2016 at 3:35 pm [Comment permalink]
1+1+3+3+3+5+5=21