Newton’s Method interactive graph
By Murray Bourne, 30 Jul 2015
I added a new interactive graph that helps explain how Newton's Method works. You can find it here:
Go to: Newton's Method Interactive Graph
Newton's Method uses differentiation to solve non-linear equations and is especially useful when we can't factor the equation. It's very commonly used by computers when solving math-based problems.
The graph allows you to explore 4 different functions, and to see what is going on when applying Newton's Method to those functions.
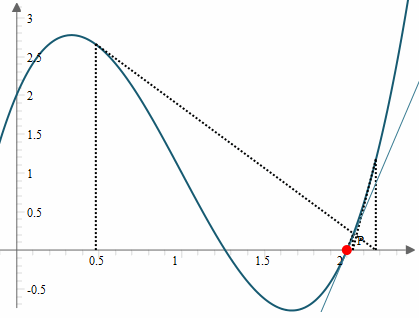
You can see one of the big traps for the unwary. It doesn't always work out that the root you get is the closest one.
For example, the initial guess in this case was x0 = 0.5. The closest root is near x = 1.3, but the actual root found is one near x = 2.
Also, strange things can happen if our first guess is too close to a local maximum or minimum. Try it!
Visuals are important
I remember when I first learned Newton's Method. We happily differentiated and substituted. The examples were always "nice" with straightforward solutions. I wasn't really sure what was going on, even though I could apply the algorithm.
A visual representation is very useful for a better understanding of this concept.
See the 2 Comments below.
25 Aug 2015 at 11:29 pm [Comment permalink]
I did the demo in EMT on my blog (should be linked). Admittedly, JavaScript is ready everywhere. But the demo looks to closed to me to be of much educational value.
26 Aug 2015 at 10:40 am [Comment permalink]
@Rene: Thanks for the information.
I have a broad range of readers with a broad range of backgrounds and even wider set of "have a go" skills. If the interactive graph requires too much work, most will leave. So the compromise is to provide something that the interested reader can explore and be up and running quite quickly.
But I agree with you it's probably best to have at least 3 or 4 interactive graphs so readers can find one that suits their level of interest and familiarity with the concept.
Now, to find 5 more hours a day to implement such a thing...