Search IntMath
Close

450+ Math Lessons written by Math Professors and Teachers

5 Million+ Students Helped Each Year

1200+ Articles Written by Math Educators and Enthusiasts

Simplifying and Teaching Math for Over 23 Years

Tips, tricks, lessons, and tutoring to help reduce test anxiety and move to the top of the class.

Swivel - data visualization

By Murray Bourne, 23 Oct 2007

I wrote earlier about IBM's Many Eyes: Browsing Visualizations, which allows users to upload their own data and to display it in interesting ways.

Here's another similar site, Swivel.

Update: (Aug 2011) It seems Swivel has disappeared (gone broke?). It's a shame.

Of the 'featured graphs' on the main page, this one caught my attention:

The top twenty hip hop artists all make more than ten million dollars a year in income.

hip-hop
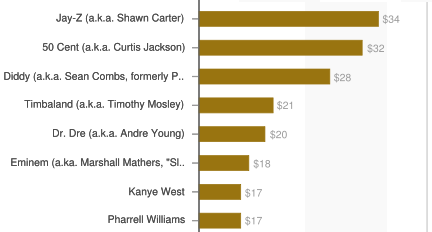
(Units are millions of dollars).

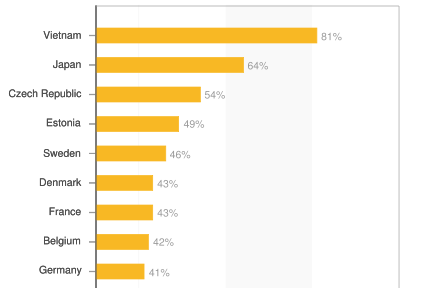
Here's another one that I found interesting: Percent atheists, agnostics, non-believers in God by Country

Swivel graph - agnostics

Swivel is claiming more than 4 millions graphs so far.

Be the first to comment below.

Leave a comment


Comment Preview

HTML: You can use simple tags like <b>, <a href="...">, etc.

To enter math, you can can either:

  1. Use simple calculator-like input in the following format (surround your math in backticks, or qq on tablet or phone):
    `a^2 = sqrt(b^2 + c^2)`
    (See more on ASCIIMath syntax); or
  2. Use simple LaTeX in the following format. Surround your math with \( and \).
    \( \int g dx = \sqrt{\frac{a}{b}} \)
    (This is standard simple LaTeX.)

NOTE: You can mix both types of math entry in your comment.

top

Tips, tricks, lessons, and tutoring to help reduce test anxiety and move to the top of the class.