Microsoft Mathematics 4.0 - now for $0
By Murray Bourne, 17 Aug 2011
I reviewed Microsoft Math 3.0 a while back. It was quite good, even though it had some bugs (and it cost just under $20).
The new release, Microsoft Mathematics 4.0, comes for free. There are 2 flavors of MS Mathematics 4.0:
- The standalone version (requires either Windows XP, Vista, Windows 7 or later and .NET framework, which is also a free download).
- The add-in version, which only works with Microsoft Word 2010, Microsoft OneNote 2010, and Microsoft Office Word 2007. The add-in allows you to easily insert math objects (graphs, equations, etc) into Word or OneNote.
The Add-In is invoked from the ribbon in MS Word. It's reasonably well integrated, but there are a few usability gripes, as mentioned below.
The current version seems to do everything that Microsoft Math 3.0 did before. As the site says:
Microsoft Mathematics can help you with the following tasks:
- Compute standard mathematical functions, such as roots and logarithms
- Compute trigonometric functions, such as sine and cosine
- Find derivatives and integrals, limits, and sums and products of series
- Perform matrix operations, such as inverses, addition, and multiplication
- Perform operations on complex numbers
- Plot 2-D graphs in Cartesian and polar coordinates
- Plot 3-D graphs in Cartesian, cylindrical, and spherical coordinates
- Solve equations and inequalities
- Calculate statistical functions, such as mode and variance, on lists of numbers
- Factor polynomials or integers
- Simplify or expand algebraic expressions
Like all such software, you need to know what you can ask it to do, and how to ask it. It won't directly solve your word problems - you still need to use your brains for that!
So is MS Math 4.0 any good?
MS Math does a good job of graphing 2-D and 3-D graphs.
For example, here is a paraboloid. You can easily draw a plane intersecting the 3-D surface (the plane is light blue on the left of the diagram below and the intersection of the plane is a parabola, in dark blue). This is quite a useful feature, but only exists in the Add-In version.
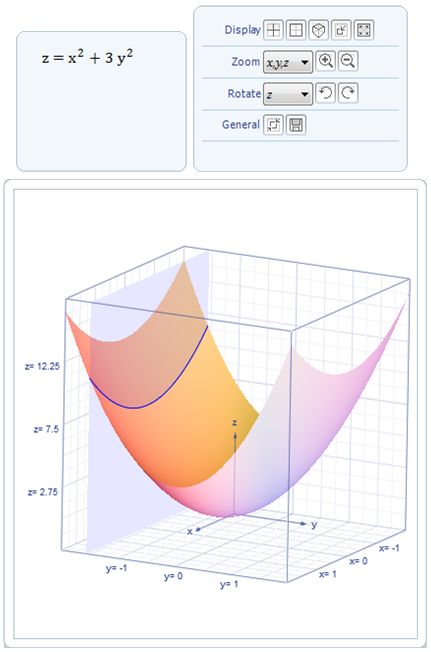
A paraboloid graphed using MS Math 4
How does MS Math 4 graph arccot(x)?
I wrote recently about the fact that different math software disagree on the correct graph for y = arccot(x). (That is, the inverse of the reciprocal of tan(x)). Here's the article:
Which is the correct graph of arccot x?
Microsoft Mathematics 4.0 interprets the graph in the following way, the same as Mathematica and Matlab, but not the same as Mathcad's version.
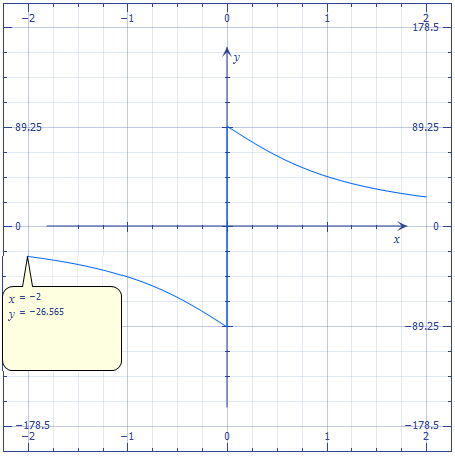
MS Math 4's graph of y = arccot(x), showing the Trace facility
In the above graph, you can see the "trace" facility in use. By clicking on the Trace forward arrow on the graph in MS Math, you can move along the graph as x takes values from smaller to larger numbers.
![]()
Solving Equations
You can easily solve equations using Microsoft Math 4.0, as you could earlier in MS MAth 3.0, as the following example shows:
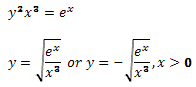
Micrsoft's choice of font in MS Math 4 results in quite unreadable text at times. Believe it or not, that's xraised to the power 3 in the above example.
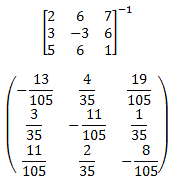
Inverse of a Matrix
Inverses of matrices are possible, too.
One gripe
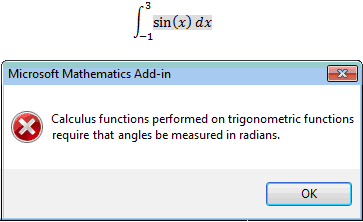
Next I tried out numerical integration, this time using the Word Add-In. This is what I asked Mathematics 4.0 to calculate:
![]()
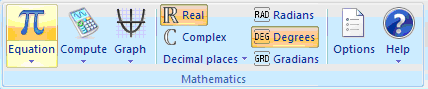
What I got was the following error message:
No argument with the requirement to change to radians, but I then needed to go back a few steps, and change the setting to radians, as follows:
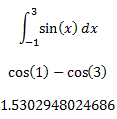
Then I needed to enter the question again, and finally it gave me the answer:
How about some usability testing, Microsoft? It doesn't take much to change the warning dialog box to include an option "Would you lilke to change to radians now?".
Or even better, it could just change to radians automatically, and alert the reader what happened. (This is what happens in the standalone version, as it should.)
Should you get both the standalone and the Add-In for Word and OneNote versions?
Personally, I'd stick to the stand-alone MS Mathematics 4.0 application, since you don't need Word or OneNote to use it. You can always copy-paste into Word or OneNote.
However, the image you get after pasting from the standalone version is really poor quality and there seems to be more features in the Add-In version.
Conclusion
This is a very good product, especially for the price ("free" after purchasing Windows and Word). Microsoft has finally figured out that it's good business to give away stuff.
It's certainly worth adding MS Math 4 to your kit of math tools.
The download links again:
Microsoft Mathematics 4.0 Standalone download
Microsoft Mathematics Add-In for Word and OneNote
See the 16 Comments below.
18 Aug 2011 at 1:19 am [Comment permalink]
I just tested the application and I can say it's a very good one. Very intuitive and friendly. The integration with Word (copy/paste between the apps) is perfect, so the Standalone version do the job well. The fact that it's free is awesome advantage.
I think that the best application of that app is when students are writing homeworks. I will give it a try to introduce this app with a Linear Algebra course this semester.
6 Sep 2011 at 11:24 am [Comment permalink]
[...] Graphing Calculator — A downloadable graphing calculator for those of you heading towards trigonometry and calculus soon. Hopefully this will remain free or one like it. [...]
29 Dec 2011 at 1:16 am [Comment permalink]
[...] 4.0 properly. I refer you instead to the excellent review posted by Murray Bourne on his website, squareCircleZ. Keyboard shortcuts are available for Mathematics 4.0, but I don’t know if these are [...]
31 Mar 2012 at 8:48 pm [Comment permalink]
I have installed and now running Microsoft Mathematics 4.0. While it is wonder, especially in graphing capability, I have experiences some problems so far:
1. I can't change the scales on both the x- and y-axes.
2. I plotted the circle x^2+y^2=2 centred at (0,0). However, when I shift the centre elsewhere, e.g. to plot (x-0.2)^2+(y-0.37)^2=2, the graph does not show up.
Suggestions on the above are welcome.
Rgds
1 Apr 2012 at 4:26 pm [Comment permalink]
Hi GORO Systems.
1. To change scale, you just drag around the graph (left-right or up-down). If you want to zoom in or out, just use the wheel on your mouse (while the cursor is over the graph). If you mean you want to change the upper and lower x- and y-values, click on the "Plotting Range" button near the top and input your values. Your circle will look like a circle then!
2. You're right! I also found it didn't plot that example. However, I did get the desired result by plotting
sqrt(2-(x-0.2)^2)+0.37 and -sqrt(2-(x-0.2)^2)+0.37 on the same graph.
It did successfully plot their own example (hyperbola) ((x-3)^2 / (a^2)) - ((y-2)^2 / (b^2)) = 1, which contains similar elements to your circle. Oh well, must be a bug.
Good luck with it!
18 Nov 2012 at 1:48 am [Comment permalink]
Murray says: "1. To change scale, you just drag around the graph (left-right or up-down)." On my ver 4.0.1108, dragging around the graph just seems to drag around the graph, not change the scales. What am I missing?
18 Nov 2012 at 2:01 am [Comment permalink]
Addendum: Sorry ... I was actually trying to change the displayed axis numbers to integer values from the peculiar values the graphing program chooses. I have not succeeded.
18 Nov 2012 at 4:51 pm [Comment permalink]
@Peter: Yes, I have no idea what the MS engineers were on when they came up with those odd scales for the axes. Not only do the major ticks not make sense (like 2.201), but that is divided into 4 divisions, giving 0.55025 per gray division.
No, I tried several ways to get a sensible scale, but no luck. I even tried expanding the range bit by bit, hoping it would jump to something decent, but I gave it away. Let me know if you ever figure it out.
20 Nov 2012 at 2:06 am [Comment permalink]
OK. Ask the program to simultaneously graph these two equations: (1) y=x-2; (2)y=x-3. Enter both, hit Graph and see the two parallel lines on the graph. Then clear the second equation and watch the y-axis scale as you hit the Graph button.
20 Nov 2012 at 8:09 pm [Comment permalink]
Totally weird! Then, zooming out gives (I think) strange results - it becomes powers of 2. Um, why?
But thanks, at least we now know a way to force axes that are a bit more sensible. But sheesh!
21 Oct 2013 at 4:39 pm [Comment permalink]
Mathematics 4.0.1108.0 : Plotting Range
How can I set the Proportional Display as default?
I cannot find a manual that goes into technical details? Apparently Mathematics does not have a chat room? This software seems to have been abandoned?
22 Oct 2013 at 9:05 pm [Comment permalink]
Hi Hal
Unfortunately, trial and error is probably your best bet! It is unlikely anyone from Microsoft will help.
17 Sep 2014 at 2:09 am [Comment permalink]
When I try to solve a system of linear simultaneous equations (2 or more variables) with Microsoft Maths, I only get answers which indicate that "x belongs to real nos, y belongs to real nos" --- I get no numerical values! Any help?
26 Feb 2016 at 5:58 pm [Comment permalink]
Is it possible to plot multiple graphs on the ADD in version? Like plotting intersecting planes/ paraboloids etc. I tried with no success. The stand alone version does have this facility, but the graphs or surfaces don't appear with colours clear/deep/ contrasting enough to see for example their curves on intersection and the like. How can I do this? Thanks for your help.
29 Feb 2016 at 9:07 am [Comment permalink]
@TJ: I don't use Micro$oft Office any more, so haven't played with the add-in version for some time.
Probably the easiest thing to do is to get what you want on the stand alone version, take a screen shot, then tweak the colors using Photoshop or similar.
It's actually usually best to play with the live 3D object (moving it around to see it from all angles is better than a static image any day), but I'm guessing you want this for student notes or similar. If it's for class use, I'd go for the live object.
29 Feb 2016 at 5:24 pm [Comment permalink]
Thanks.
It would be nice though to work with multiple graphs on "live" ADD in version.