GeoGebra math software - a review
By Murray Bourne, 19 Feb 2015
GeoGeobra is an intelligent graphing software that allows the user to interactively explore 2D and 3D Cartesian & Euclidean geometry - as well as calculus. Best of all - it's a free offering!
You can download it from https://www.geogebra.org/download.
From their blurb:
GeoGebra is a free and multi-platform dynamic mathematics software for schools that joins geometry, algebra and calculus.
Building an Interactive Document in GeoGebra
Let's go through the process of creating a document in GeoGebra. Our document will allow the end-user to explore the changing slope of a polynomial as x changes value.
First, we enter the function at the bottom of the screen, using the carat "^" for powers of x:
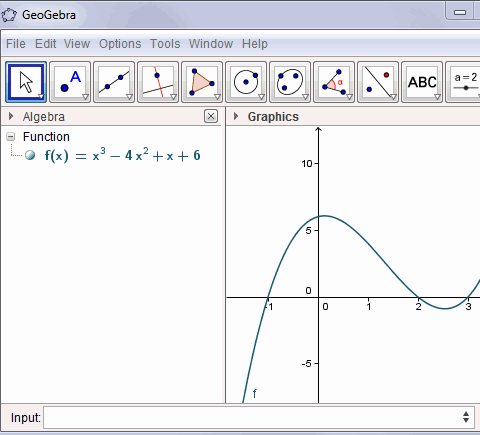
The program converts the function display (see under "Free objects") so that it is more easily read by a human. I have scaled the y-axis by clicking on the "Move" tool (the one on the far top right) and simply dragging the axis to the desired scale.
Next, we are going to add a tangent line to our curve. We add a new point on the function using the "New point" tool:
We place the new point anywhere on the curve by clicking on the curve. It will now "stick" to the curve as we drag it.
Note the other tools that are available on this tool item:
- Intersection of 2 two curves
- Midpoint between 2 points
Now we choose the "Tangent" tool as follows:
Note the other tools that are available on this drop-down. You can construct:
- Perpendicular line through a point
- Parallel line through a point
- Perpendicular bisector
- Bisector of an angle
- Diameter line of a conic section
Helpful hints appear on the GeoGebra interface that tell us to click on the point, then the curve.
We now have a tangent line. The exploratory activity we can do now is to drag the point "A" to any position on the curve (after selecting the "pointer" icon at the far left) and the tangent line follows along. Even better, we can get a readout of the actual slope as we move around the curve, by typing in:
s = Slope[a]
Rather than just giving a numerical value for the slope, it actually gives a triangle with base length 1 unit, indicating more clearly what a slope at a point really means. The result for one part of the curve is as follows:
Visual Calculus
Let's now add the curve of the first derivative to our existing plot. (Of course, we expect the first derivative curve to be a parabola, since it will be a polynomial of degree 2).
We achieve this by entering:
Derivative[f]
The green curve is the first derivative curve (a parabola, as expected):
We can trace the locus of a point (B) moving on the first derivative curve, as follows:
To create the point B, I entered:
B = (x(A), f'(x(A)))
This means the point B will have the same x-value as A (we write this using x(A)), and the y-value will be the same as the y-value of the first derivative curve, which I wrote with f'(x(A)).
You can use GeoGebra to examine critical points like local maximums and minimums on the curve and the point of inflection (point A) illustrated above.
Other Tools
GeoGebra is a feature-rich offering. The other tools available in GeoGebra that I have not already mentioned include:
- Rotate an object around a point
- Draw line segments
- Draw vectors
- Draw polygons (including regular polygons)
- Construct various circles, arcs and sectors
- Angles, distances and areas
- You can add text and images
- You can zoom in and out on objects
Split Functions
GeoGebra will draw piece-wise functions (with a little coaxing). You can achieve the following (with a vector thrown in):
Output
I like the variety of output options. You can either:
- Save your file for later use (it will have a .GGB extension)
- Save the graph as an image in PNG, EPS, SVG or EMF format
- Save the graph to the clipboard (for manipulation in an image editing program or for pasting into a document)
- Save as an interactive Web page, but this can only be uploaded to GeoGebra Tube (not to your hard drive)
Euclidean Geometry
GeoGebra allows you to easily create angles, polygons and conics.
As you can see in the regular dodecagon above, GeoGebra allows you to measure angles, including internal angles.
Output and mobile apps
There is now a HTML5 export option in GeoGebra (so it can be run on Web pages without java) and there are a range of apps for iOS, Android, Windows, Mac, Chromebook and Linux.
3D Graphs
Geogebra 5 has 3D graph capability. It has been quite a wait, but it's been worth it.
Here's a graph of
a(x,y) = x^2 + cos(y)
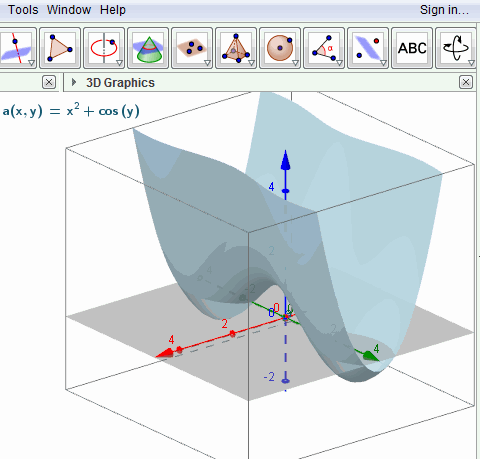
You can easily zoom in and out, and rotate the graph left-right and up-down to see what it looks like from all angles.
In 2D graphs, where you can re-scale the graph by dragging either the x- or y-axis. However, this feature is missing from 3D graphs (so far, at least).
Resources
There is a vibrant GeoGebra community that provides a lot of free help and resources.
GeoGebraTube has thousands of ready-made interactive files made with GeoGebra.
The GeoGebra Forum has many experts who are willing to help with any issues you face.
Conclusion
GeoGebra is an impressive geometry and calculus exploratory tool. I tend to use it as an exploratory tool when I need something quick. It's a great tool, but I tend to stick to JSXGraph when developing interactive graphs of IntMath.
GeoGebra is more intelligent than MS Math 4.0, which I reviewed earlier (it has 3D capability - see Microsoft Math 4.0), but the audience for each product is not exactly the same. Having the 2 products will give you some excellent tools for exploring mathematics.
Do yourself a favor - download GeoGebra now!
See the 4 Comments below.
2 Mar 2015 at 5:12 am [Comment permalink]
Geogebra is second to none.
12 May 2015 at 6:54 am [Comment permalink]
Love your site. It's been a while since I taught algebra to my gifted elementary school students. Now that I'm retired I'm available to homeschool my 13-year old nephew and need to brush upon algebra. Thanks for the easy-to- understand instructions.
27 Sep 2015 at 5:29 am [Comment permalink]
TrianCal - Open in Google Chrome.
(Triangles online calculator developed by Jesus S.)
YouTube: https://youtu.be/V2IV7lY52mA
I propose this free online calculator triangles without advertising to help students with geometry, not exercising, because their calculations formulas are not displayed. It is designed in a didactic way to check and view the
exercises.
TrianCal is online calculator triangles that works with any combination of values including sides, heights, angles, the area or perimeter of any triangle, calculating it with the minimum possible value (typically three).
Other functions:
- Draw the triangle (s) with GeoGebra.
- Set the range of values allowed into each element.
- The type of angle.
- The type of triangle by its sides and angles.
- Selection of language (English or Spanish).
- Select and angles [degrees (°), Radians, Degrees, minutes and seconds (°
'") or degrees and minutes (°')] is.
- Number of decimal places to show in the results (0-15).
- You can use the arrow keys and the Tab key to navigate through the
settings.
- Drop-down menu to select values comfortably.
- Create a link (URL) to the current triangle.
- An icon mail to communicate with the author.
NOTE: You must use the Google Chrome browser to display correctly TrianCal.
Examples of possible combinations:
- The area, perimeter and other data (side, height or angle), if the outside
equilateral triangle would not need the third data.
- 2 angles and other data (if the value of the other data is not put aside
the value of "a" at the time of drawing the triangle is 10).
- One hand, one high and one angle.
- 3 heights.
- 3 sides.
- 2 heights and perimeter.
- Any other combination of values.
27 Oct 2016 at 6:30 pm [Comment permalink]
So helpful the software is.. Thumbs up!