GeoGebra now with 3D graphs
By Murray Bourne, 28 Nov 2014
GeoGebra released version 5 a few months back. GeoGebra is a powerful and free graphing tool that anyone learning - or teaching - mathematics would find useful.
For me, the best feature of the new version is the ability to create 3D graphs.
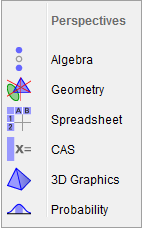
When you first open GeoGebra now, you are greeted with this choice of Perspectives:
Choosing "3D Graphics", you get several new panels, which allow you to create 3D objects like a line perpendicular to a plane, a plane intersecting a cone, a plane through 3 points, a sphere, and so on:
![]()
You also get a set of empty 3-D coordinate axes, like this:
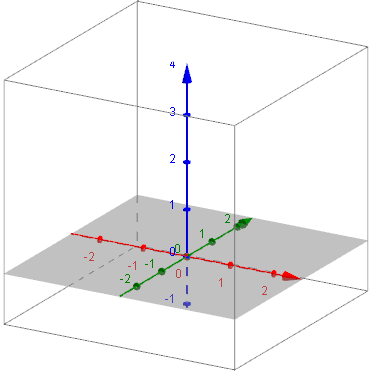
Of course, you can still create 2D graphs as before, and the interface is largely unchanged for that aspect.
Some 3D graph examples
Let's draw a few 3D surfaces using GeoGebra.
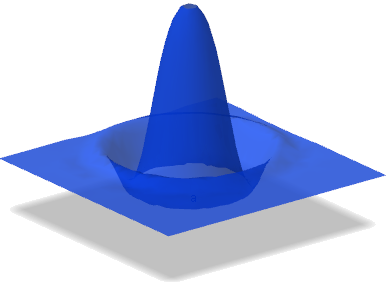
Here's a water droplet-like shape, whose equation is:
z(x, y) = 1 + 3 cos((x2 + y2) 2) e(-(x2 + y2;))
Next, here are some 3D graphs that were suggested by some comments on the article How to draw y^2 = x - 2?
One reader asked how to draw some graphs involving interesting asymptotes. I used some different software for those ones (which has a problem where asymptotes appear as vertical "walls" - but shouldn't be there at all.
Those graphs are similar to the following ones, which also involve an asymptote:
z = y / x2
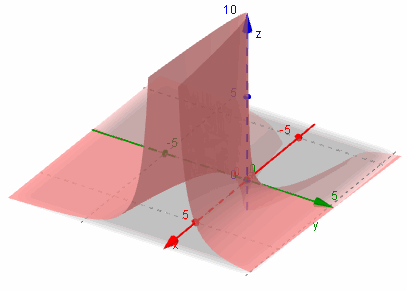
Let's consider this curve for a bit (using GeoGebra to help, of course), and investigate it from different angles.
If we fix y = 1 then the curve z = 1 / x2 (it's in 2 dimensions) looks like this:
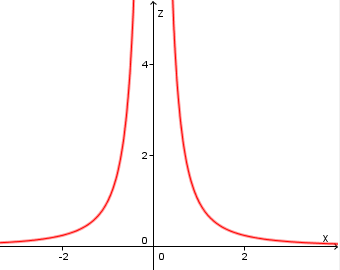
We can see this shape in our 3D graph above.
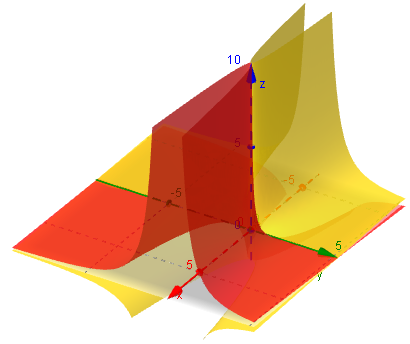
Let's now add the negative of the above graph, that is z = −y / x2
Here's what it looks like, along with our original surface:
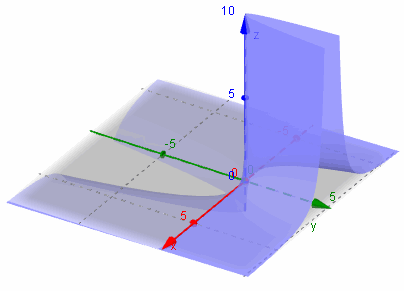
Next, we'll look at z = −x / y2 by itself:
Now, we add its negative: z = −y / x2 (the one in green):
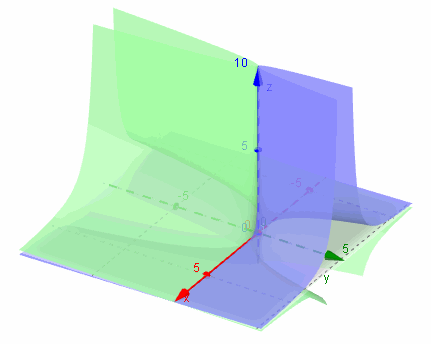
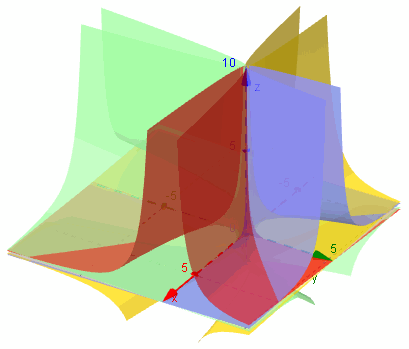
Now for all 4 surfaces together:
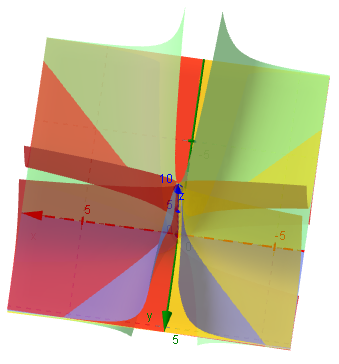
Here they are from a different point of view:
Conclusion
GeoGebra is a versatile and powerful tool. With this new version, they have addressed some of the shortfalls of earlier versions, since it now handles 3D graphs, and there are non-Java output possibilities so you can view the applets, and interact with them, on your tablet devices.
Trying to imagine surfaces in 3D really pushes your brain envelope - but this tool makes things a lot easier!
Sweet!
See the 11 Comments below.
28 Nov 2014 at 9:08 pm [Comment permalink]
looks good enough for me to look for a place
to buy it
29 Nov 2014 at 5:37 pm [Comment permalink]
@Frank: Good thing it's free, then!
30 Nov 2014 at 11:25 pm [Comment permalink]
from where i can download GeoGebra5.
1 Dec 2014 at 8:50 am [Comment permalink]
@Sangee: The opening sentence of the article contains a link to GeoGebra, otherwise, Google search will find it very quickly for you.
7 Feb 2015 at 8:38 pm [Comment permalink]
hallo 🙂 i still have some difficulties how to draw a graph 9x^2+25y^2+9z^2=225. would you please show me how to draw the graph? thank you very much. i really appreciate your help.
8 Feb 2015 at 4:58 pm [Comment permalink]
Hello Puput. This is a 3-dimensional surface, something like a rugby league ball.
You could use this 3D grapher to help. (You would draw the top half first - the bottom half will be identical)
https://www.intmath.com/vectors/3d-grapher.php
8 Feb 2015 at 5:54 pm [Comment permalink]
it is said for f(x,y) so that means i only could draw 9x^2+25y^2 meanwhile i have 9x^2+25y^2+9z^2=225. what about the z-axis? thank so much for ur help 🙂
8 Feb 2015 at 8:18 pm [Comment permalink]
Yes, you'll need to solve your equation for z. You'll get 2 answers. Put the positive one in the grapher.
11 Jun 2015 at 10:11 pm [Comment permalink]
If you don't want to solve your equation for z you can use Graphing Calculator 3D instead. It allows plotting implicit equations:
http://www.runiter.com/graphing-calculator/
20 Jan 2017 at 10:33 am [Comment permalink]
I can not draw z=-y/x^2
21 Jan 2017 at 11:17 am [Comment permalink]
@zang: Do you mean on GeoGebra? Just enter the right hand side of your equation in the Input box and press "Enter".