The melting Arctic - a disturbing application of math
By Murray Bourne, 20 Mar 2008
The article Maths and climate change: the melting Arctic is from the Millennium Mathematics Project people.
It features the work of Peter Wadhams, Professor of Ocean Physics and Head of the Polar Ocean Physics Group at University of Cambridge.
Wadhams outlines the seriousness of an Arctic meltdown:
"As the ice area decreases you're replacing an area of white, which reflects about 90% of the solar radiation, by open water, which reflects less than 10%. As the sea ice retreats you're absorbing a lot more radiation and this increases the rate of warming at high latitudes." This effect can raise the global average rate of warming by 20%.
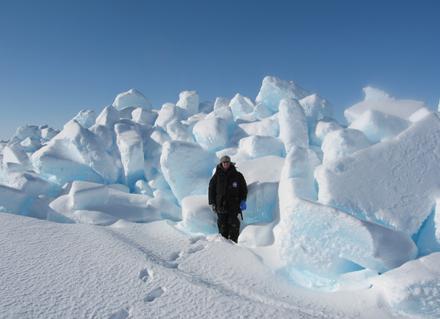
Image source.
The article goes on to describe a simple ice growth model that involves differentiation (from calculus) and vectors. The model predicts that the growth of ice (thickness, h) over time is proportional to the square root of the elapsed time:
h(t) = k√t (where k is a constant).
This means that when ice is thin, it grows quickly, but as time goes on the rate of growth decreases.
Then Wadham goes on to model the movement of ice that is floating on water and is being acted on by the wind and by the Coriolis force.
This is mathematics that I wish we didn't have to concern ourselves so much with. But we do...
Check out the full Plus Magazine article.
[Thanks to Li-sa, one of my loyal readers, for the link to Plus Magazine.]
See the 9 Comments below.
22 Mar 2008 at 5:28 am [Comment permalink]
Warming sea water is the major source of CO2. The solubility of CO2 decreases as temperature increases. Conversely. Cold sea water at high latitudes is a strong sink. When sea ice forms and covers the cold water, much of the major sink is lost and atmospheric CO2 levels rise. Sea ice is also a weak source. When the global SST rises, we should expect atmospheric concentrations of CO2 to rise. Ice core data confirms that. It also falls as SST falls. The positive feedback proposed by CO2 contributing significantly to global warming thus suggests that CO2 warms the oceans, producing more CO2 which inturn makes it even warmer until we end up like Venus. In any case, the contribution of anthropogenic sources becomes relatively less and less. So with what bullet are you going to kill either?
22 Mar 2008 at 8:35 am [Comment permalink]
Thanks for your insights, Fred. You have become rather fatalistic - are you saying that in your view, it is too late to do anything?
Please note: Fred's final question is in response to my challenge in Earth killer where I asked...
...it is a chicken and egg thing, but in terms of a solution, which should we kill - the chicken?
17 May 2008 at 3:01 pm [Comment permalink]
"applecation of math" please
6 Dec 2008 at 6:02 am [Comment permalink]
Uhhh, maybe it was true that Artic ice did go decrease a couple of years ago, but as of this year Artic ice has grown by 40%! It appears that it fluctuates over time. Granted, if the ice did melt in such fashion we would be in trouble, but so far such doomsday scenarios have held very little validity.
I think that the changes in ice are due to natural factors, especially the Sun.
And by the way, CO2 isn't Venus's problem, its way too close to the Sun!
6 Dec 2008 at 6:05 am [Comment permalink]
And Fred, where's the evidence? I don't want something from the IPCC either...THere are charts that conclusively show that the increase in C02 has done nothing to increase sea levels...
Sea levels are increasing very slowly, and they have been increasing for the last 5,000 years or as long as recorded history goes. Sealevels have not changed their level of ascent because Joe decided to use his car instead of his bicycle to go to work...
10 Dec 2011 at 3:42 am [Comment permalink]
Man Made Global warming is a lot of bunk perpetrated by self indulgent politically motivated scum bags out to rape the public troughs for their "research grants"
17 Dec 2011 at 3:41 pm [Comment permalink]
Are you serious, AnchorBeach? Go talk to the South Pacific islanders whose houses are already being flooded, and are having to make plans to move.
We'll all be affected...
8 Aug 2012 at 6:37 am [Comment permalink]
Murray, I am surprised that your mathematical rationality (and terrific web site) does not flow over into your thoughts on AGW. The 40% of the ice gone is just flat nonsense.
Here are items to consider:
1. I write from a location about an hour north of Toronto. From my window in the distance is a drumlin created in the last ice age. 10,000 years ago the location was under more than a mile of ice. Then it melted. The earth does warm and cool even without man's influence.
2. Michael Mann's infamous hockey stick graph, now shown to be poor statistics, was based on data from the Climate Research Unit at University of East Anglia. In addition to the emails the Fortran source code for the model was 'made available' and being of a certain age I could still read Fortran. In general the Fortran code was a rat's nest. Obviously a model worked on by dozens of post-grad climatology students (likely untrained in programming), but my main interest was the section on data cleansing where outliers were removed. There is no doubt that the approach they used - removing the lower outliers, but keeping the upper outliers - gave the data and upward bias. You can read the code for yourself.
3. I have visited the Columbia Icefield in North Western Canada three times. Signs of GW are clear. Since the 1850s the glacier has retreated significantly and old pictures from the turn of last century indeed confirm that. The IPCC report, however, estimates that AGW started around the mid 1970s. Before that date CO2 production from industrialization was not enough to create (so they say) the green house effect. So the question is what caused the Columbia Icefield (and many other glaciers) to recede from 1850 to 1970?
I felt that your answers glossed over two of the three possibilities ( GW does not exist, GW does exist, but is a natural phenomenon perhaps augmented slightly by some CO2 production) and just uncritically went for AGW unequivocally exists based on the South Sea argument. I lived in Auckland for a time and heard the line many times, but could never find clear evidence of rising water levels. Indeed there are watermarks in the harbour in Hobart from the early 1900 that show water levels are very much the same as they were then.
Of course, I am not going to change your mind on the issue (after all it has become an article of faith), but I do hope that my posting will, at least, provide you with some food for thought.
thanks
9 Aug 2012 at 9:47 am [Comment permalink]
@Ellen. Thanks for your comments.
What I know is man has done to the environment whatever it takes to make a quick buck.
OK, let's assume man-made global warming doesn't exist. Either way, I would rather my grandchildren live in an unpolluted world with plenty of natural forests, with edible food.
What I see is an increasingly polluted world (air and water, the 2 most vital ingredients) and food that I'm scared to eat each day.
Erring on the side of caution in this issue, and making massive efforts to reclaim our polluted world, is surely a better way to go than the present situation...?