8. Curves in Polar Coordinates
r = sin (2θ) − 1.7
This is a real graph using polar coordinates.
Okay, I admit to adding the
eye and smile. :-)
Later, on this page...
Don't miss the Polar graphs interactive applet.
We'll plot the graphs in this section using a computer. You'll also learn how to sketch some of them on paper because it helps you understand how graphs in polar coordinates work.
Don't worry about all the difficult-looking algebra in the second part of the answers - it's just there to demonstrate that polar coordinates are much simpler than rectangular coordinates for these graphs. We convert them using what we learned in the last section, Polar Coordinates.
Helpful Background
Curves in polar coordinates work very similarly to vectors. See:
Examples
Need Graph Paper?

Sketch each of the following functions using polar coordinates, and then convert each to an equation in rectangular coordinates.
Example 1: r = 2 + 3 sin θ
(This polar graph is called a limacon from the Latin word for "snail".)
Answer
Using a Table of Values to Sketch Polar Coordinate Curves
If we don't have a computer and we need to sketch the function on paper, we need to set up a table of values as follows:
| θ (degrees) | `0°` | `30°` | `60°` | `90°` | `120°` | `150°` | `180°` |
|---|---|---|---|---|---|---|---|
| θ (radians) | `0` | `π/6` | `π/3` | `π/2` | `(2π)/3` | `(5π)/6` | `π` |
r = 2 + 3 sin θ |
`2` | `3.5` | `4.60` | `5` | `4.6` | `3.5` | `2` |
| θ (degrees) | `180°` | `210°` | `240°` | `270°` | `300°` | `330°` | `360°` |
|---|---|---|---|---|---|---|---|
| θ (radians) | `π` | `(7π)/6` | `(4π)/3` | `(3π)/2` | `(5π)/3` | `(11π)/6` | `2π` |
r = 2 + 3 sin θ |
`2` | `0.5` | `-0.60` | `-1` | `-0.60` | `0.5` | `2` |
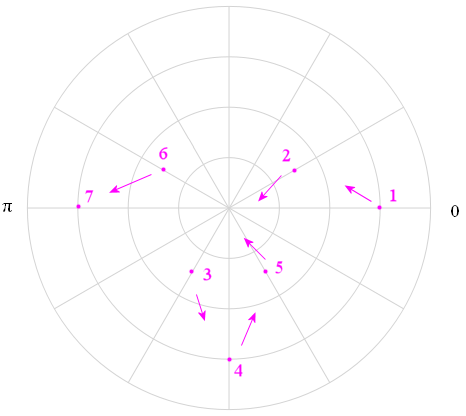
The first 7 points from this table are (2, 0○), (3.5, 30○), (4.60, 60○), (5, 90○), (4.6, 120○), (3.5, 150○), and (2, 180○).
We plot these points (they are numbered) on the polar graph. I have also indicated with arrows the direction you need to go when joining the points.
Recall: A negative "r" means we need to be on the opposite side of the origin.
Here's the complete graph.
Graph of r = 2 + 3 sin θ, a limacon.
Conversion to Rectangular Form
Once again we convert our polar function into rectangular form so we can see how much simpler polar form is for certain functions.
`r = 2 + 3\ sin\ θ`
In rectangular form, this is:
`sqrt(x^2+y^2)=2+3y/sqrt(x^2+y^2)`
`x^2+y^2=2sqrt(x^2+y^2)+3y`
`x^2+y^2-3y=2sqrt(x^2+y^2)`
`(x^2+y^2-3y)^2=4(x^2+y^2)`
`x^4+2x^2y^2+y^4-6y(x^2+y^2)+` `9y^2` `=4(x^2+y^2)`
`x^4+2x^2y^2+y^4-6y(x^2+y^2)-` `4x^2+` `5y^2` `=0`
Notice how much simpler the polar form is compared to the rectangular form.
Here's another example of a limacon:
Graph of r = 2 -2 sin θ, a limacon.
Example 2: r = 3 cos 2θ
Answer
Using a Table of Values to Sketch this Curve
What if you can't use a computer to draw the graph?
You'll need to set up a table of values, as follows. I've put degrees and the radian equivalents.
| θ (degrees) | 0○ | 30○ | 60○ | 90○ | 120○ | 150○ | 180○ |
|---|---|---|---|---|---|---|---|
| θ (radians) | `0` | `π/6` | `π/3` | `π/2` | `(2π)/3` | `(5π)/6` | `π` |
`r = 3\ cos\ 2θ` |
`3` | `1.5` | `-1.5` | `-3` | `-1.5` | `1.5` | `3` |
| θ (degrees) | 210○ | 240○ | 270○ | 300○ | 330○ | 360○ |
|---|---|---|---|---|---|---|
| θ (radians) | `(7π)/6` | `(4π)/3` | `(3π)/2` | `(5π)/3` | `(11π)/6` | `2π` |
`r = 3\ cos\ 2θ` |
`1.5` | `-1.5` | `-3` | `-1.5` | `1.5` | `3` |
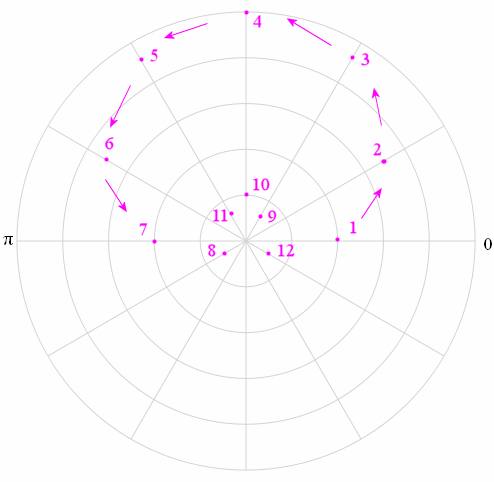
The first 7 points from this table are (3, 0°), (1.5, 30°), (-1.5, 60°), (-3, 90°), (-1.5, 120°), (1.5, 150°), and (3, 180°).
Placing those first 7 points on a polar coordinate grid gives us the following:
We start at Point 1, (3, 0°), and move around the graph by increasing the angle and changing the distance from the origin (determined by substituting the angle into r = 3 cos 2θ. I have drawn arrows to indicate the basic direction we have to head in to get to the next point.
Recall: A negative "r" means we need to be on the opposite side of the origin.
I have only plotted the first 7 points above to keep the graph simple. Clearly, we would need to calculate more than this number of points to get a good sketch. (You would need at least twice as many points as I have in the table above - every 15° would be adequate.)
Here's the complete graph.
Graph of r = 3 cos (2θ).
[In the above graph, angles are in radians, where π radians = 180°. To learn more, see: Radians.]
Notice the curve is fully drawn once θ takes all values between 0 and 2π.
Conversion from Polar to Rectangular Coordinates
Next, here's the answer for the conversion to rectangular coordinates.
Why? We convert the function given in this question to rectangular coordinates to see how much simpler it is when written in polar coordinates.
To convert `r = 3\ cos\ 2θ` into rectangular coordinates, we use the fact that
cos 2θ = cos2 θ - sin2 θ.
So r = 3 cos 2θ = 3(cos2 θ - sin2 θ).
Now since `cos\ theta=x/r`, `sin\ theta=y/r` and `r^2=x^2+y^2`, we have
`cos^2theta=(x^2)/(r^2)=(x^2)/(x^2+y^2)`
and
`sin^2theta=(y^2)/(r^2)=(y^2)/(x^2+y^2)`
Taking the positive square root of `r^2=x^2+y^2` gives us:
`r=sqrt(x^2+y^2)`
So `r = 3 cos\ 2θ` in polar coordinates is equivalent to
`r=3(cos^2theta-sin^2theta)`
`sqrt(x^2+y^2)=3(x^2/(x^2+y^2)-y^2/(x^2+y^2))`
`sqrt(x^2+y^2)=3/(x^2+y^2)(x^2-y^2)`
`(x^2+y^2)^(3"/"2)=3(x^2-y^2)`
in rectangular coordinates.
We see that our equation in polar coordinates, r = 3 cos 2θ, is much simpler than the rectangular equivalent.
Example 3: r = sin θ − 1
(This one is called a cardioid because it is heart-shaped. It is a special case of the limacon.)
Answer
We need to sketch `r=sin theta-1`.
Using the same process for the earlier examples, we obtain:
Graph of r = sin θ − 1, a limacon.
For the curve above, when θ = 0, `r = −1`, so the curve starts on the left side of the origin.
Conversion to Rectangular Form
To convert to rectangular form, we use r2 = x2 + y2 and
`sin^2theta=(y^2)/(r^2)=(y^2)/(x^2+y^2)`
In rectangular form, r = sin θ − 1 is:
`sqrt(x^2+y^2)=y/sqrt(x^2+y^2)-1`
`x^2+y^2=y-sqrt(x^2+y^2)`
`x^2+y^2-y=-sqrt(x^2+y^2)`
`(x^2+y^2-y)^2=x^2+y^2`
`x^4+2x^2y^2+y^4-2y(x^2+y^2)+y^2` `=x^2+y^2`
`x^4+2x^2y^2+y^4-2y(x^2+y^2)-x^2` `=0`
Example 4: `r = 2.5`
Answer
We need to sketch `r = 2.5`
In this example, we cannot see "θ" in the function we are given. This means the radius, r is constant, no matter what value angle θ takes.
Here's the graph:
Graph of r = 2.5, a limacon.
What is the Equivalent in Rectangular Coordinates?
We convert the function given in this question to rectangular coordinates to see how much simpler it is when written in polar coordinates.
To convert `r = 2.5` into rectangular coordinates, we use
r2 = x2 + y2
In this example, `r = 2.5`, so `r^2= 6.25`.
So this gives us: x2 + y2 = 6.25
Not surprisingly, this is the similar to the equation for a circle we obtained in The Circle section earlier.
Example 5: r = 0.2 θ
This is an interesting curve, called an Archimedean Spiral. As θ increases, so does r.
Answer
This time we are graphing r = 0.2 θ in polar coordinates.
Graph of r = 2.5, a limacon.
Note the value of r is always `0.2` times the value of θ (of course, we are in radians).
See also Equiangular Spiral.
Later, we'll learn how to find the Length of an Archimedean Spiral.
Example 6: r = sin (2θ) − 1.7
This is the face I drew at the top of this page. We're not even going to try to find the equivalent in rectangular coordinates!
You can play with this graph in the following interactive applet.
Interactive Graph
You an explore the above graphs using this interactive graph.
Use the slider below the graph to trace out the curves.
See what happens as you go beyond the normal domain for these graphs (i.e. when `theta` is less than `0` or greater than `theta = 2pi`).
Change the function using the select box at the top of the graph.
Choose function:
Copyright © www.intmath.com
Polar to Rectangular Calculator
If you're looking to convert complex numbers in polar form to rectangular form, then check out the Polar to Rectangular Online Calculator.
Application
Check out Polar Coordinates and Cardioid Microphones for an application of polar coordinates.