Biorhythm Graphs - background
By Murray Bourne, 16 Jan 2012
I re-developed my Biorhythm Graphs page (for various technical reasons). You can input anyone's birthday and you can see what their state will be (or was) on any day (well, that's the theory).
Biorhythms are interesting, but not at all scientific. They are a quirky example of Composite Trigonometric Graphs, since they involve 3 sine curves starting at (0,0) on your birthday, and having 3 different periods.
Biorhythm cycles - starting from birth
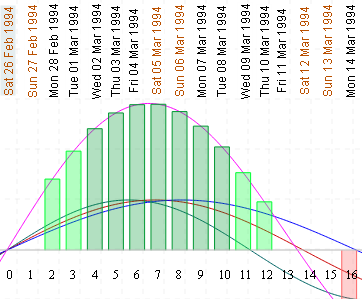
They work on the principle that our bodies, minds and emotions go through various cycles throughout the month, leading us to have pre-determined "good days" and "not-so-good" days. I have assumed the "best" days (colored green on my graph) will be the days when all 3 cycles add to give us the largest amplitude, and the "worst" days (colored red) will be when all 3 cycles push us into the depths of despair.
According to the Skeptik's Dictionary, biorhythms were first "observed" by the Berlin physician Wilhelm Fliess (a good friend of psychologist Sigmund Freud's) in the 19th century.
Fliess originally proposed a 23-day "male" cycle and a 28-day "female" cycle. An Austrian engineering teacher proposed a 33-day "mind" cycle, based on his observations of how well his students performed over time.
They are now known as the physical, emotional and intellectual cycles. Apparently:
There is the 38-day intuitional cycle, the 43-day aesthetic cycle, and the 53-day spiritual cycle.
Head on over and put in your dates here:
Math behind the graphs
Periods: To get graphs having wavelengths of 23, 28 and 33 days, I used these sine curves:
- Physical: y = sin(2πx/23)
- Emotional: y = sin(2πx/28)
- Intellectual: y = sin(2πx/33)
The period of the general graph y = sin(bx) is 2π/b. In the first graph, b = 2π/23, so the period is 2π/[2π/23] = 23.
Composite graph: A "composite" graph is the result of adding the y-values for 2 or more given graphs.
Bars: For the green and red bars used for the "good days" and "not-so-good" days, I used Reimann Sum rectangles. These are used to approximate the area under a curve. (See also this Riemann Sums java applet.)
Conclusion
Don't take biorhythms seriously! However, hopefully you've learned some math from this example.
The link again: Interactive Biorhythm Graphs
See the 8 Comments below.

20 Jan 2012 at 7:38 pm [Comment permalink]
[...] plays around with Biorhythm Graphs: “A bit of fun — a non-scientific application of composite sine [...]
26 Apr 2012 at 9:58 pm [Comment permalink]
Hello Murray: I am a 65 Y.O. American amateur mathematical astronomer. Interesting site! Re: biorhythms. I must disagree as to it not being "scientific": the original data was empirically derived by Dr. Wilhelm Fleiss, a noted Berlin ENT and best friend of Freud. He charted fever spikes. I see that his numbers ( as later modified by others) match the lunar perigee/apogee cycle PERFECTLY.
The annual lunar P/A extremes have a 1.1875 year periodicity.
Biorhythm theory claims 23/28/33 day cycles total 21252 days for a complete cycle. That's also 1.1875 X 49 years.
The lunar P/A extremes also have a 1.1875 X 11 X 3 periodicity for movements between Solstices and equinoxes. The primary biorhth book that I found has multiple examples of plane crashes and heart attacks and the primary separation between the incident dates and specific points in the gestation of the individuals profiled is also 1.1875 X 11 X 3 years.
That number ( 39.1875 years) is ALSO the primary number in the movement of the Sun in a geometric pattern ( a hexagram) around the solar system barycentre. Like to see some data charts?
Sincerely,
Ron Stewart
20 Jun 2012 at 5:07 pm [Comment permalink]
Hello Murray, I am a mathematician from Nigeria. This your site is very interesting. biorhythms is something to look at critically, it seems real and scientific to me from Ron Stewart argument.Keep the site rolling.
Olaiju O.A
5 Oct 2012 at 10:20 am [Comment permalink]
Hi,
If you can find notes of a lecture by Rudolf Steiner on
30th December 1910 you will find therein another aspect mentioned about Fliess rhythms mentioned & discussed. Apparently there was research on number of days between a grandmother's death and birth dates of grandchildren before and after her death within specific family units. How those longer rhythms are then seen in relationship to the rhythms to which Fliess drew attention is mentioned ! Has anyone done any additional research on that aspect ?
12 May 2013 at 8:32 pm [Comment permalink]
Hello
I am a student at university and my project is about "the effect of the biorhythm cycles on the performance of the employees".
Could I have the standard questionnaire of the biorhythm cycles please?
Thanks
12 May 2013 at 9:04 pm [Comment permalink]
@Mohamad: Sorry, I don't have such a questionnaire. Perhaps another reader can suggest something?
29 Jun 2014 at 10:57 pm [Comment permalink]
by the way, you can have your biorhythms always with yourself:
https://itunes.apple.com/ua/app/biorhythm-cycles/id879917580?mt=8
May be you will be interested in different length of cycles.
Classic model told as that is 23, 28 and 33 days. But the lust researches in this area give as more accurate values. Read description for this program for details.
Sorry for small advertisement. 😉
3 Jul 2014 at 11:22 am [Comment permalink]
Hi Pete. Advertisement allowed because it's a free product :-).