Predicting the Spread of AIDS
We use differential equations to predict the spread of diseases through a population. The growth of AIDS is an example that follows the curve of the logistic equation, derived from solving a differential equation. We will see how to solve differential equations later in this chapter.
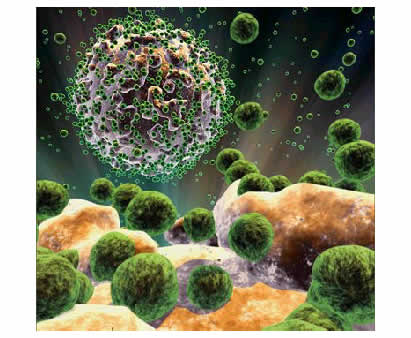
The HIV Virus invades a white blood cell...
Image source: Healthmad
Populations usually grow in an exponential fashion at first:
Exponential growth of a population, `P(t)=100e^(0.4t)`.
However, populations do not continue to grow forever, because food, water and other resources get used up over time. Differential equations are used to predict populations of people, animals, bacteria and viruses that are being affected by external events.
The logistic equation (developed in the mid-19th century) allows for a growth term AND an inhibition term. It is predicted that the AIDS epidemic will follow the pattern of the logistic equation.
If
A = number of people affected by the virus at time t,
P = the total population (a constant), and
c is a constant,
then the rate of growth of the virus at time t is given by the differential equation:
`(dA)/(dt)=cPA-cA^2=cA(P-A)`
The term `cPA` is the growth term and `-cA^2` is the inhibition term.
AIDS Example
AIDS is spreading through a city of 50,000 people who take no precautions. The virus was brought to the town by 100 people and it was found that 1000 people were infected after 10 weeks. How long will it take for half of the population to be infected?
Answer
We answer the first part of the problem here.
`P = 50000`, so our differential equation becomes:
`(dA)/(dt)=50\ 000cA-cA^2`
`=cA(50\ 000-A)`
Solving using Scientific Notebook gives us the number of people affected at time t:
`A(t)=(50\ 000)/(1+499e^(-50\ 000ct))`
[We'll see how to solve this kind of problem in the Separation of Variables page, later in this chapter.]
Now, we are told that at `t = 10`, `A = 1000`.
So now we can substitute and solve for `c`:
`c = 4. 6416 xx 10^-6`
So substituting this value of c into the expression for A(t) gives us:
`A(t)=(50\ 000)/(1+499e^(-0.23208t))`
So the number affected at time t is given by:
`A(t)=(50,000)/(1+499e^(-0.23208t))`
The graph of the number of people, `A(t)`, affected by AIDS after t years is:
S-shaped logistic growth of a population at time `t`.
We see in the graph the S-shaped curve which the logistic equation can take.
Now to find how long it takes for half the population (25,000) to be infected:
`25,000=(5,000)/(1+499e^(-0.23208t)`
Solution: `t = 26.8`.
So we conclude that half of the population will be infected after about 27 weeks (marked on the graph above).
Newly Reported AIDS Cases in Australia to 2005
The following table shows actual reported AIDS cases (cumulative) in Australia.
| Year | 1981 | 1984 | 1987 | 1990 | 1993 | 1996 | 1999 | 2002 | 2005 |
|---|---|---|---|---|---|---|---|---|---|
| AIDS cases | 2 | 55 | 802 | 2623 | 5060 | 7493 | 8415 | 9118 | 9609 |
There is a strong bias towards men acquiring AIDS, with around 95% of the cases being male.
Men: 9119
Women: 490
Total: 9609
Data Sources: Dept of Health and Ageing, Australia, and Avert.
We see that the data roughly follows the expected S-shaped logistic equation curve. The decrease in growth from the late 1990s is largely due to suppressant drugs and education.
Reported HIV AIDS Cases - Australia
Let's now move on to see what differential equations are and then learn how to solve them.