Understanding Graphs in Geometry

What is a Graph?
A graph is a visual representation of a relationship between two or more variables. It is used to illustrate the connections between the variables in a way that can be easily understood. Graphs are used in mathematics, science, engineering, and many other fields.Graphs can be classified into two types: x and y graphs. X and y graphs are also known as coordinate graphs or Cartesian plane graphs. These graphs use two axes, the x-axis and the y-axis, to illustrate the relationship between the two variables. The x-axis is the horizontal axis, and the y-axis is the vertical axis.
Plotting Points on a Graph
To plot points on a graph, you need to know the coordinates of the points. The coordinates of a point are the values of the x and y variables. For example, if you want to plot the point (2, 3), the x coordinate is 2 and the y coordinate is 3. You can plot the point by drawing a line on the graph, starting at the origin (0, 0) and going 2 units to the right on the x-axis and 3 units up on the y-axis.
Interpreting the Graph
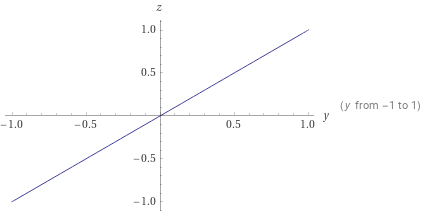
Once you have plotted the points on the graph, you can interpret the graph. The graph can show the relationship between the two variables. For example, if the points form a line, then the relationship between the x and y variables is linear. If the points form a curved line, then the relationship between the x and y variables is nonlinear. The slope of the line is also important. The slope is the ratio of the change in the y variable to the change in the x variable.
Scatter Plots
Scatter plots are graphs that show the relationship between two variables. The points on the graph are scattered, and there is no linear or nonlinear pattern. Scatter plots are used to show the correlation between the two variables. If the points form a line, then the two variables are correlated. If the points form a random pattern, then the two variables are not correlated.
Practice Problems
1. Plot the point (5, -2) on the graph.
Answer: The point (5, -2) is 5 units to the right of the origin on the x-axis and 2 units below the origin on the y-axis.
2. What is the slope of the line with the equation y = -3x + 5?
Answer: The slope of the line is -3.
3. What type of graph would you use to show the correlation between two variables?
Answer: A scatter plot would be used to show the correlation between two variables.
4. Plot the point (-4, 3) on the graph.
Answer: The point (-4, 3) is 4 units to the left of the origin on the x-axis and 3 units above the origin on the y-axis.
5. What is the equation of the line with the slope of -2?
Answer: The equation of the line with a slope of -2 is y = -2x + b, where b is the y-intercept.
Summary
In this article, we discussed x and y graphs, also known as coordinate graphs or Cartesian plane graphs. We discussed how to plot points on the graph and how to interpret the graph. We also discussed scatter plots, which are used to show the correlation between two variables. We ended with some practice problems to help you better understand x and y graphs in geometry.
FAQ
What is X and Y on a graph?
X and Y on a graph are the two axes which intersect to form the coordinate plane. The X-axis is typically the horizontal axis, and the Y-axis is typically the vertical axis.
How do you find the X and y-axis on a graph?
The X-axis and Y-axis can be found by looking for the two lines which intersect to form the coordinate plane. The X-axis is typically the horizontal line, and the Y-axis is typically the vertical line.