7. Lissajous Figures
by M. Bourne
Lissajous figure
x = sin(t/18),
y = cos(t/20)
We can obtain very interesting graphs when each of the x- and y- coordinates are given as functions of t. In this case, we have parametric equations. (We see another example of parametric equations later in the applications of differentiation section.)
Lissajous Figures are a special case of parametric equations, where x and y are in the following form:
`x = A\ sin(at + δ)`
`y = B\ sin(bt + γ)`
[These can also be written in terms of cosine expressions, or a combination of sin and cos, since we can shift sine onto cosine easily. See Graphs of y = a sin(bx + c).]
Lissajous curves can be seen on oscilloscopes and are the result of combining 2 trigonometric curves at right angles.
Don't miss..
See interactive animations of these Lissajous figures at:
Example 1
Need Graph Paper?

Sketch the graph of the parametric equation where:
x = 2 cos t
y = cos(t + 4)
Answer
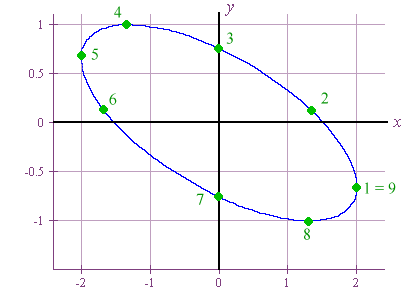
We need to set up a table of values to see what is happening. We give each point a "point number" so it is easier to understand when we graph the curve.
| `t` | `0` | `π/4` | `π/2` | `(3π)/4` | `π` | `(5π)/4` | `(3π)/2` | `(7π)/4` | `2π` |
| `x` | `2` | `1.4` | `0` | `-1.4` | `-2` | `-1.4` | `0` | `1.4` | `2` |
| `y` | `-0.6` | `0.1` | `0.7` | `1.0` | `0.7` | `-0.1` | `-0.8` | `-1.0` | `-0.7` |
| Pt no. |
1 | 2 | 3 | 4 | 5 | 6 | 7 | 8 | 9 |
Here is the resulting curve, with the numbered points included. Point 1 is actually equivalent to Point 9, since we have done one complete cycle of the ellipse as t goes from 0 to 2π.
Lissajous figure: Ellipse
x = 2 cos(t),
y = cos(t + 4)
Common Lissajous Curves
Lissajous curves take certain common shapes depending on the values of the variables in the expressions
x = A sin(at + δ) and
y = B sin(bt + γ)
In Example 1, we saw that the curve was an ellipse. If A ≠ B and a = b, we obtain an ellipse. (See more on the Ellipse.)
In the example in Curvilinear Motion, the Lissajous figure is a circle. If A = B and a = b = 1, we will get a circle.
Example 3 on this page is part of a parabola. We can also obtain a straight line as well.
Example 2 - ABC Logo
The Australian Broadcasting Corporation is a (mostly!) high quality public television and radio network. The ABC logo is a Lissajous figure. The parametric equations that describe the logo are:
x = cos(t/3)
y = sin t
The graph is as follows:
ABC logo
x = cos(t/3),
y = sin(t)
For more information by the ABC, see The ABC's of Lissajous Figures.
Example 3
Sketch the graph of the parametric function:
`x = cos(t + π/4)`
`y = sin\ 2t`
Answer
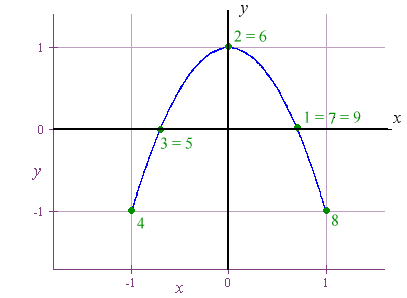
We draw a table of values:
| `t` | `0` | `π/4` | `π/2` | `(3π)/4` | `π` | `(5π)/4` | `(3π)/2` | `(7π)/4` | `2π` |
| `x` | `0.7` | `0` | `-0.7` | `-1` | `-0.7` | `0` | `0.7` | `1` | `0.7` |
| `y` | `0` | `1` | `0` | `-1` | `0` | `1` | `0` | `-1` | `0` |
| Pt no. |
1 | 2 | 3 | 4 | 5 | 6 | 7 | 8 | 9 |
The sketch is:
Lissajous figure: Parabola (part)
x = cos(t + π/4),
y = sin(2t)
This curve is part of a parabola.
Of course, it would have been better to start our values from `t = (3π)/4` (Point 4) and only use Points 4, 5, 6, 7, and 8, but often you don't know that until you have drawn it.
Example 4 - Mathematical heart
This last one's not actually a Lissajous figure, but like such curves, it's made of parametric equations involving trigonometric functions.
The parametric equations are:
x = 5 sin3t,
y = 4 cos(t) − 1.3 cos(2t) − 0.6 cos(3t) − 0.2 cos(4t)
Mathematical heart
x = 5 sin3t,
y = 4 cos(t) − 1.3 cos(2t) − 0.6 cos(3t) − 0.2 cos(4t)
See also: Animated Lissajous figures