Biorhythm Graphs
by M. Bourne
Biorhythms may not be very scientific, but it's true that on some days we are full of energy while on other days we find it difficult just getting out of bed. Biorhythms try to explain this by considering the interplay between three cycles: emotional, physical and intellectual.
When a particular cycle is high, it means it is easy to do well in that area (for example, if our intellectual cycle is high, we will do better in examinations). But if we are in the low part of a cycle, it is difficult to do well (we may have more arguments if our emotional cycle is low.)
At birth, each cycle is at 0 (neither positive nor negative). The cycles have different length:
- Physical: 23 days,
- Emotional: 28 days, and
- Intellectual: 33 days
Interactive Biorhythms Graph
In the following interactive graph, enter your birthday at the top and you can see what is happening in your own emotional, physical and intellectual cycles. It tells you when your "good" and "not-so-good" days will occur (or have occurred in the past).
You can also use it to figure out why your friend (or mother) is crabby today!
Physical Emotional Intellectual Good days Not-so-good days
Copyright © www.intmath.com
The numbers along the horizontal axis indicate the number of days since birth.
Background
These biorhythm cycle graphs are sine curves with the same amplitude, but varying period.
To obtain the graphs, we use:
- Physical: `y = sin((2πt)/23)`
- Emotional: `y = sin((2πt)/28)`
- Intellectual: `y = sin((2πt)/33)`
The "good" and "not-so-good" days are determined by the sum of the 3 cycles (which you can see if you check the "Show composite curve" box above the graph). See: Composite Trigonometric curves for some background.
Explanation
Here's a typical composite curve for days 100 to 150:
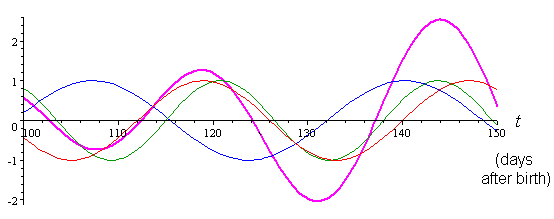
We see that near day 130, all the cycles are against us and we will probably have a terrible day. Two weeks later, near day 145, everything is coming together nicely and we should have an excellent day.
The composite curve (in magenta color) is the sum of the 3 cycles:
`y = sin((2πt)/23)+ sin((2πt)/28)+ sin((2πt)/33)`
Disclaimer
I repeat...
Biorhythms are not scientific. However, they are an interesting example of sine curves with different periods, and of composite trignometric curves.
Credits
Thanks to:
- Graph developed using JSXGraph.
- Ztor's Flash-based biorhythm graph (no longer available), which inspired the above interactive applet.