2. Acceleration (`v`-`t`) Graphs
by M. Bourne
Acceleration is the change in velocity per time.
A common unit for acceleration is `"ms"^-2`. An acceleration of `7\ "ms"^-2` means that in each second, the velocity increases by `7\ "ms"^-1` (also written as `7\ "m/s"`).
We can find the acceleration by using the expression:
`text(acceleration)=text(change in velocity)/text(change in time`
We can write the above using the equivalent
`text(acceleration)=(Deltav)/(Deltat`
where the Greek letter `Δ` (Delta) means "change in".
In other words, the slope of the velocity graph tells us the acceleration.
The Area Under the `v`-`t` Graph
A very useful aspect of these graphs is that the area under the v-t graph tells us the distance travelled during the motion.
This concept is important when we find areas under curves later in the integration chapter.
Example 1
A particle in a generator is accelerated from rest at the rate of `55\ "ms"^-2`.
a. What is the velocity at `t = 3\ "s"`?
b. What is the acceleration at `t = 3\ "s"`?
c. What is the distance travelled in `3` seconds?
d. Graph the acceleration (as a v - t graph) for `0 ≤ t ≤ 3\ "s"`.
Answer
a. Velocity `= 55 × 3 = 165\ "ms"^-1`
b. The acceleration is a constant `55\ "ms"^-2`, so at `t = 3\ "s"`, the acceleration will be `55\ "ms"^-2`.
c. The distance travelled in `3` seconds is `165 × 1.5 = 247.5\ "m"`. We obtain this from the area under the line between `0` and `3` (i.e. the area of the shaded triangle below).
d. Note in the graph that we have velocity on the vertical axis, and the units are m/s.
The graph finishes at (3, 165).
Recall: Area of a trapezoid
NOTE: A trapezoid has one pair of parallel sides. (It's called a "trapezium" in British English.)
A trapezoid (trapezium), parallel sides `a` and `b`, height `h`.
We find the area of a trapezoid by simply finding the average of the two parallel sides, and multiplying by the distance between them (usually called the "height"):
`text(Area)=((a+b)h)/2`
We'll make use of this result in the next question.
Example 2
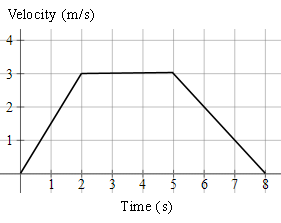
A body moves as described by the following v-t graph.
a) Describe the motion.
b) What is the distance travelled during the motion?
c) What is the average speed for the motion?
Answer
a) From `t = 0` to `2`, the acceleration was `a=(Deltav)/(Deltat)=3/2=1.5\ text(ms)^-2`
From `t = 2` to `5`, the acceleration was `0\ "ms"^-1`.
The body was neither speeding up nor slowing down.
From `t = 5` to `8`, the acceleration was `a=(Deltav)/(Deltat)=(-3)/3=-1\ text(ms)^-2`
The body was slowing down, so the acceleration was negative.
b) The distance travelled is the area of the trapezoid (trapezium).
`text(distance)=((a+b)h)/2`
`=((8+3)(3))/2`
`=16.5\ text(m)`
c) `text(average speed)=text(distance travelled)/text(time taken)`
`=16.5/8`
`=2.1\ text(ms)^-1`