3. Kinematics Exercises
1. A charged particle in an accelerator starts from rest, accelerates at `1.5\ "ms"^-2` for `3\ "s"` and then continues at a steady speed for a further `6\ "s"`.
Draw the v-t graph and find the total distance travelled.
Answer
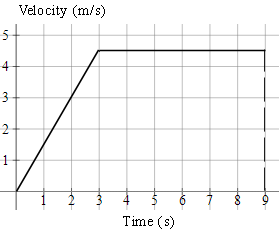
Total distance travelled is the area under the graph (in this case we need to find the area of a trapezium).
`text(distance)=((a+b)h)/2`
`=((9+6)xx4.5)/2`
`=33.75\ text(m)`
2. A speedboat starts from rest, accelerating at `2\ "ms"^-2` for `20\ "s"`. It then continues at a steady speed for a further `30\ "s"` and decelerates to rest in `30\ "s"`. Find:
(a) the distance travelled in `"m"`,
(b) the average speed in `"ms"^-1` and,
(c) the time taken to cover half the distance.
Answer
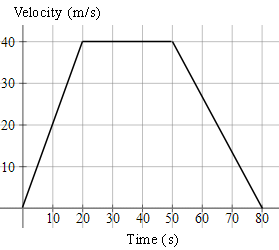
a) `text(distance)= "area of trapezium"`
`=((a+b)h)/2`
`=((80+30)(40))/2`
`=2200\ text(m)`
b) `text(average speed)=text(distance travelled)/text(time taken)`
`=2200/80`
`=27.5\ text(ms)^-1`
c) We need to find the time when the area of the trapezium is half of its original area, or `1100 text(m)^2`, as shown in the graph.
The base of this unknown trapezium has length `t`, and the top of the trapezium will have length `t-20`. So we have:
`"area of trapezium" =((a+b)h)/2`
`1100=((t+[t-20])40)/2=20(2t-20)`
`55=2t-20`
`75=2t`
`t=37.5 text(s)`
So it will take `37.5\ "s"` to cover half the distance.
3. A car is travelling at a constant speed of `72\ "km/h"` and passes a stationary police car. The police car immediately gives chase, accelerating uniformly to reach a speed of `90\ "km/h"` in `10\ "s"` and continues at this speed until he overtakes the other car. Find:
(a) the time taken by the police to catch up with the car,
(b) the distance travelled by the police car when this happens.
Answer
The v-t curve for the car is represented by the red line, while that v-t curve for the police car is the blue line.
We need to find the unknown time t (in seconds), when the police catch up to the car. We find this by comparing the distance travelled by each (it will be the same distance at the overtaking point.) So we need to set the area under the v-t curve for the car (the pink shaded area) to be equal to the area under the v-t curve for the police car (the blue shaded area).
a. The area under the curve for the car at time t (in seconds) is simply `72t`. (It is a rectangle, `72` high and width t).
The area under the trapezium (trapezoid) for the police car at unknown time t, using `A = (a + b)h/2` is:
`(t + t - 10) × 90/2 = 45 (2t - 10)`
We set these equal to find the required time: `72t = 45 (2t - 10)`
That is, when `72t = 90t - 450`
So `t = 25\ "s"` will be the time the police car catches up.
b. Both of the cars have travelled `72 × (25/3600) × 1000 = 500\ "m"` during those `25\ "s"`.
[We have used `d = s × t` and converted from seconds to hours (since the velocities are given in `"km/h"`).]
4. Two sport cars start from rest at the same place. One of them, colored red, accelerates at `0.90\ "ms"^-2` for `15\ "s"`, and continues at constant speed thereafter. The other car, colored blue, accelerates at `0.85\ "ms"^-2` for `20\ "s"` and then remains at that speed.
Draw both journeys on the same velocity-time graph and determine the time and distance that the second car overtakes the first car.
Answer
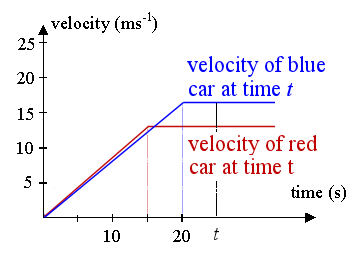
The velocities they reach are 0.9 × 15 = 13.5 ms-1 and 0.85 × 20 = 17 ms-1 respectively.
Similar to the problem above, we have:
First car's (red) distance at time t is found by finding the area of the trapezoid whose boundary is the t-axis, the red lines and the vertical line representing time at t seconds. This of course assumes `t > 15` (otherwise, we have negative distances, and the trapezoid only starts at `t = 15`.)
So the distance (at time t)` = 1/2 × 13.5 (t + t − 15)`
The distance of the second car (blue) is found by finding the area of the blue trapezoid, bounded by the blue lines, the t-axis and the vertical line. (And this one assumes `t > 20`, for the same reasons as above.)
So the distance (at time t)` = 1/2 × 17 (t + t − 20)`
The distance when they meet is the same, so:
`1/2 × 13.5 ×(2t − 15)` ` = 1/2 × 17 × (2t − 20)`
Solving gives:
Time `= 19.643\ "s"`
Distance` = 163.93\ "m"`
Dilemma
However, this solution gives us a dilemma. As mentioned above, the expressions we found for the area of the trapezoids required t to be more than 15 s and 20 s, respectively.
We can confirm the blue car overtakes the red car before `20` seconds, by calculating the distances travelled at that time.
After `20` seconds:
Red car has travelled `0.5 × (20+5) × 13.5 = 168.75\ "m"`
Blue car has travelled `0.5 × 20 × 17 = 170\ "m"`
The blue car has travelled further than the red car, so it means it has already overtaken the red car.
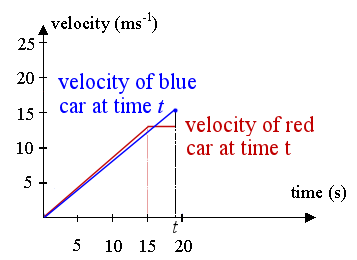
Back to the drawing board
So, in fact, for this question we need to consider the area of the blue triangle, not the blue trapezoid.
This is the correct diagram for finding t:
The red car's distance is fine from before (it's a trapezoid):
`d = 1/2 × 13.5 (t + t − 15)`
But the blue car's distance at t is the area of the triangle (not trapezoid) bounded by the blue line and the vertical line at t (we are taking `1/2` base times height):
distance` = 1/2 × t × 0.85 × t `
Equating these gives:
6.75(2t − 15) = 0.425t2
Solving gives:
t =12.14 s, t = 19.63 s
The first solution has no practical meaning, since `t > 15` for the expression to work.
So we conclude the time taken for the blue car to overtake the red car is `19.63\ "s"` and the distance travelled at that time is `163. 7\ "m"`.
Further Information
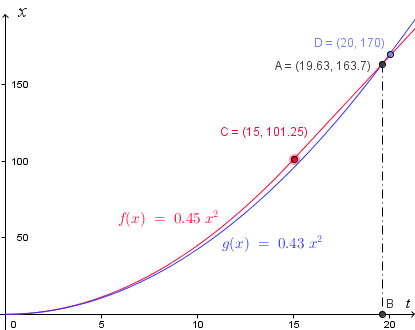
To illustrate we have found the correct answer, below is the graph of distance against time. Labelling of axes is very important in this work!
The red curve corresponds to the acceleration portion of the first race car. At `t = 15`, or point C `(15, 101.25)`, the red car stops accelerating and continues at a constant speed (CA is no longer a curve, but a straight line).
The blue curve corresponds to the second (blue) car. It doesn't accelerate as hard (its curve is below the red curve, indicating it covers less distance in the same time), but it accelerates for longer. At `t = 20`, or point D `(20, 170)`, it stops accelerating and its graph is now a straight line.
We can see the curves intersect at time `t = 19.63\ "s"`, or point A `(19.63, 163.7)`, as we found in the calculation above. This means they have covered the same distance (`163.7\ "m"`) at that time, so that's when the blue car passes the red car.
Where did the curves come from?
We learn later in the calculus section (Applications of the Definite Integral), how to find the distance function from a given velocity function using integration.
[Hat tip to reader Christopher who pointed out the "dilemma" in this problem. The earlier answer was reasonable, but not correct!]