6. Line Spectrum
Recall from earlier trigonometry that we can express the sum of a sine term and a cosine term, with the same period, as follows:
`a\ cos θ + b\ sin θ = R\ cos ( θ − α)`
where
`R=sqrt(a^2+b^2)`
and
`alpha=arctan(b/a)`
Likewise, the Fourier series
`f(t)=a_0/2` `+sum_(n=1)^oo(a_n\ cos n omega t` `{:+b_n\ sin n omega t)`
can be written in harmonics form
`f(t)=C_0+` `sum_(n=1)^ooC_n\ cos(n omegat-varphi_n)`
where
`C_1 cos (ωt - varphi_1)` is called the fundamental
`C_2 cos (2ωt - varphi_2)`, the second harmonic
`C_3 cos (3ωt - varphi_3)`, the third harmonic ... etc; and
`varphi_n` = phase angle
`C_n=` harmonic amplitude `=sqrt((a_n)^2+(b_n)^2`
We met harmonics before.
A plot showing each of the harmonic amplitudes in the wave is called the line spectrum.
Note: Waves with discontinuities such as the saw tooth and square wave have spectra with slowly decreasing amplitudes since their series have strong high harmonics. Their 10th harmonics will often have amplitudes of significant value compared to the fundamental.
In contrast, the series of waveforms without discontinuities and with a generally smooth appearance will converge rapidly to the function and only a few terms are required to generate the wave.
Example 1
Plot the first 4 terms of the line spectrum for the Fourier Series:
`f(t)=pi/2` `+sum_(n=1)^oo1/(2n-1)cos nt` `+sum_(n=1)^oo((-1)^n)/(2n)sin nt`
Answer
We can see from the series that
`a_n=1/(2n-1)`
`b_n=((-1)^n)/(2n)`
Now, using `C_n=sqrt((a_n)^2+(b_n)^2)` for each term, we have:
| `a_n=1/(2n-1)` | `b_n=((-1)^n)/(2n)` | `C_n=sqrt((a_n)^2+(b_n)^2)` |
| `a_1=1` | `b_1=-1/2` | `C_1=sqrt(1^2+(-1/2)^2)=1.118` |
| `a_2=1/3` | `b_2=1/4` | `C_2=sqrt((1/3)^2+(1/4)^2)=0.4167` |
| `a_3=1/5` | `b_3=-1/6` | `C_3=sqrt((1/5)^2+(-1/6)^2)=0.260` |
| `a_4=1/7` | `b_4=1/8` | `C_4=sqrt((1/7)^2+(1/8)^2)=0.190` |
The resulting line spectrum is:
The line spectrum for the function `f(t)`.
The above Fourier series has an interesting graph. (NOTE: The following is not the plot of line spectrum asked for in the question, and that we found in the Answer. It's the plot of the above Fourier series.)
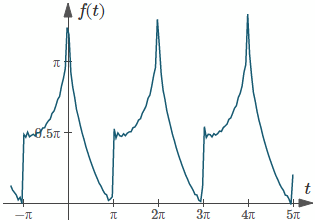
Graph of the first 30 terms of `f(t)`.
Music Examples
Example 2: Harmonics and Sound
When we listen to different musical instruments playing the same note, they sound different to us because of the different combinations of harmonics contained in the note.
For example, if a flute and a violin both play G above middle C, the harmonic spectrum is quite different.
G has a frequency of 392 Hz and the harmonics are all multiples of this fundamental frequency (or about 800 Hz, 1200 Hz, 1600 Hz, etc).
Harmony (2 or more notes sounding at the same time) works because of harmonics (look for the chord GBD contained within the harmonics of the note G).
You can see the relative values of the harmonics in the following sound spectrum images of a flute and a violin playing G4.
Flute
Violin
[Images source: University of New South Wales Physics Department]
Example 3: Java Applet - Fourier Series and Sound
The following link leads to a great Java applet to play with. (It's on an external site.) He is using Fourier Series expressed in the form
`f(t)=C_0+sum_(n=1)^ooC_ncos(n omega t-varphi_n)`
You can change the mean value (C0), amplitude of each harmonic (Cn) and also fn, which changes the phase shift. You can hear the sounds that result from adding different harmonics.
While you're there, check out the other applets and lots of interesting stuff at: