1. Velocity (s-t) Graphs
Example 1
This general graph represents the motion of a body travelling at constant velocity. The graph is linear (that is, a straight line).
Recall that linear equations have the general form
y = mx (where m is a constant and x is a variable).
The number m is called the slope of the line (the vertical rise over the horizontal run).
In the above graph, we have the function:
displacement = velocity × time
or
s = v × t
Velocity is constant and time is a variable.
NOTE: We use the variable "s" for displacement. Be careful not to confuse it with "speed"!
We note that the graph passes through `(0,0)` and has slope v. The slope of the line tells us the velocity. We can also write the velocity using delta notation:
`v=(Deltas)/(Deltat)`
which means
"change in displacement over change in time".
If we have a high velocity, the graph has a steep slope. If we have a low velocity the graph has a shallow slope (assuming the vertical and horizontal scale of each graph is the same).
Example 2
A marathon runner runs at a constant `12` km/h.
a. Express her displacement travelled as a function of time.
b. Graph the motion for `0 ≤ t ≤ 4\ "h"`
Answer
a. `s = 12t`, for displacement s and time t.
b. Graph of `s = 12t`.
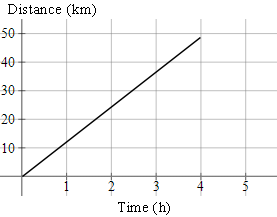
We stop the graph at (4, 48).
Displacement-time Graphs
Example 3
This is the graph of a journey by sports car:
a. What is the velocity for each stage of the journey?
b. What is the average (mean) velocity for the whole journey?
Answer
a. This table outlines the stages of the journey.
| 12:00 to 12:30 | Travelled `50` km in `30` minutes, so `100` km/h |
| 12:30 to 13:00 | Stopped |
| 13:00 to 14:00 | Travelled `50` km in `60` minutes, so `50` km/h |
| 14:00 to 14:30 | Stopped |
| 14:30 to 15:00 | Travelled `100` km back towards the starting point in `30` minutes, so `-200` km/h |
b. Even though the whole journey was `200\ "km"` (`100\ "km"` out and `100\ "km"` back) in `3` hours, the displacement for the journey (the distance from the starting point) is `0\ "km"`.
So the average velocity is `0\ "km/h"`.
On the other hand, the average speed was `"distance travelled"/"time taken" = 200/3 = 66.7\ "km/h"`.
In summary,
`"ave velocity" = "displacement"/"time"`
`"ave speed" = "distance"/"time"`
Example 4
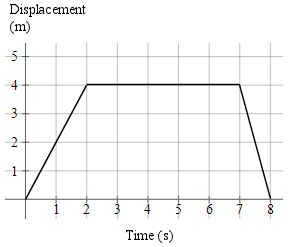
A particle in a magnetic field moves as follows:
Find the velocity for each part of the motion.
Answer
For `t = 0` to `2`: `v = (Deltas)/(Deltat)=4/2=2\ text(ms)^-1`
(The particle is moving away from the origin, at a constant velocity of `2\ text(ms)^-1.`)
For `t = 2` to `7`: `v = (Deltas)/(Deltat)=0/5=0\ text(ms)^-1`
(The particle stops for `5` seconds.)
For `t = 7` to `8`: `v = (Deltas)/(Deltat)=(-4)/2=-4\ text(ms)^-1`
(The velocity is negative for the last stage, since the particle is going in the opposite direction, back towards the origin.)