Archive for October, 2010

IntMath Newsletter: vision, wealth and slopes

1. Math application: 20/20 vision and trigonometry
2. Math application: Statistics and wealth distribution
3. Math tip: The slope of the trigonometric curves
4. Friday math movies: Math education and cell animations
6. Final thought: Dealing with mistakes
Read the rest of this entry »

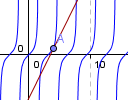
Explore the slope of the tan curve

slope of the tan curveYou can investigate the slope of the tan curve using an interactive graph.

Read the rest of this entry »

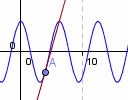
Explore the slope of the cos curve

cosine curve slope investigationWhat is the value of the slope of the cosine curve? Use an interactive graph to investigate it.

Read the rest of this entry »

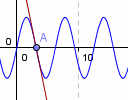
Explore the slope of the sin curve

sine curveUse an interactive graph to explore how the slope of sine x changes as x changes.

Read the rest of this entry »

Video: Arthur Benjamin’s formula for changing math education

arthur benjaminWhat math topic is most useful for people in their "real life"?

Read the rest of this entry »

What does 20/20 vision mean?

eyeWe often hear the expression 20/20 vision. What do the 2 numbers mean?

Read the rest of this entry »

Friday math movie: David Bolinsky animates a cell

animate cellOur bodies truly are beautiful and amazing. David Bolinsky from Harvard University talks about changes in medical education in this TED video.

Read the rest of this entry »

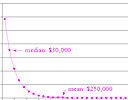
Singapore wealth - mean and median?

singapore-wealth-distributionWhen we have a distribution with a high mean but a low median, what does it look like?

Read the rest of this entry »

IntMath Newsletter: Unit circle, gmail, graphs

In this Newsletter:

1. Math tip: unit circles
2. Why do people use gmail most on Saturdays?
3. Math tip: Implicit functions (I heart math)
4. Resource: Free math graph software
5. Friday math movie: Mandelbox Trip
6. Final thought - enthusiasm

Read the rest of this entry »

Free math graphing software

graph of 3D spiral objectHere is a short review of 2 free math graphing utilities, Winplot (Windows only) and Graphics Layout Engine (which is not so easy to use).

Read the rest of this entry »

Full archive

See the blog sitemap for all previous articles.