Not getting how to calculate function equation from graph [Solved!]
HarshalDalal 02 May 2016, 06:41
My question
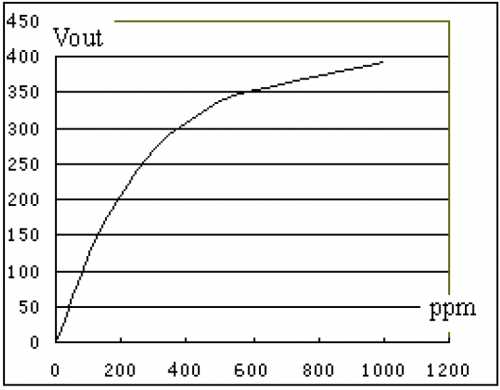
For MR513, I'm trying to find out value of x(alcohol content) with help of Y(result : vout)
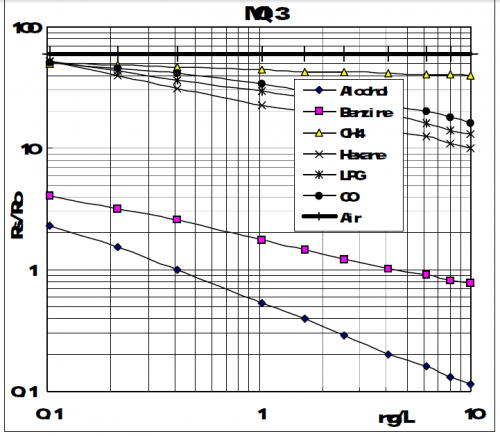
For MQ3 sensor I'm not getting How to formulate equation in magnitude bode plot which can implement in c?
Relevant page
https://www.futurlec.com/Datasheet/Sensor/MR513.pdf
What I've done so far
Hi Everyone,
I'm working on integration of 2 alcohol sensor with micro-controller. I'm pretty comfortable with micro-controller and I'm getting results with change in alcohol vapor. I have attached characteristic graph of both the sensor, also attach datasheet(Please find URL) with mail.
I had tried to finding order-3 polynomial equation with MR513 graph with the help of excel and I'm getting 'Y = (6E^-07)x^3 - (0.0015)x^2 + (1.2839)x - 4.3287'
equation which is function of X. where Y is result for x is alcohol content. But after implementing I'm getting result i.e Y and I need formula which will find value of x for value Y
X
<img src="/forum/uploads/imf-2221-mr513-graph.png" width="500" height="390" alt="functions-and-graphs" />

For MR513, I'm trying to find out value of x(alcohol content) with help of Y(result : vout)


<img src="/forum/uploads/imf-2311-mq3-graph.png" width="500" height="436" alt="functions-and-graphs" />

For MQ3 sensor I'm not getting How to formulate equation in magnitude bode plot which can implement in c?
Relevant page

<a href="https://www.futurlec.com/Datasheet/Sensor/MR513.pdf">https://www.futurlec.com/Datasheet/Sensor/MR513.pdf</a>

What I've done so far

Hi Everyone,
I'm working on integration of 2 alcohol sensor with micro-controller. I'm pretty comfortable with micro-controller and I'm getting results with change in alcohol vapor. I have attached characteristic graph of both the sensor, also attach datasheet(Please find URL) with mail.

I had tried to finding order-3 polynomial equation with MR513 graph with the help of excel and I'm getting 'Y = (6E^-07)x^3 - (0.0015)x^2 + (1.2839)x - 4.3287'
equation which is function of X. where Y is result for x is alcohol content. But after implementing I'm getting result i.e Y and I need formula which will find value of x for value Y
Re: Not getting how to calculate function equation from graph
Murray 04 May 2016, 05:52
Hello Harshal

For the first graph (ppm vs vout), what happens near and beyond 1000 ppm? That is, it seems to become almost linear for values greater than 600. Does it level out to some vout value around 450 or 500, or does it continue to increase?

This will affect how we model the curve.

Regards
Murray
X
Hello Harshal
For the first graph (ppm vs vout), what happens near and beyond 1000 ppm? That is, it seems to become almost linear for values greater than 600. Does it level out to some vout value around 450 or 500, or does it continue to increase?
This will affect how we model the curve.
Regards
Murray
Re: Not getting how to calculate function equation from graph
HarshalDalal 09 May 2016, 04:32
Hello Murray,

Thank you so much Murray for your reply and regret about delay, I was struck in some other thing.

Beyond 1000 sensor value gets saturated between 400 to 450 and basically my region of interest is between 0 PPM to 800 PPM.
X
Hello Murray,
Thank you so much Murray for your reply and regret about delay, I was struck in some other thing.
Beyond 1000 sensor value gets saturated between 400 to 450 and basically my region of interest is between 0 PPM to 800 PPM.
Re: Not getting how to calculate function equation from graph
Murray 09 May 2016, 07:40
Hi again
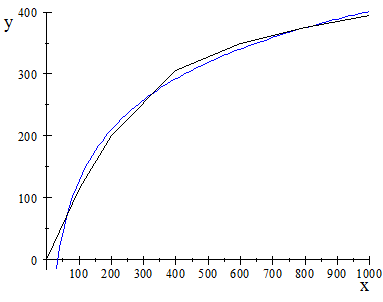
OK. I think your easiest approach is to go for a logarithmic curve.
Here's my attempt with your original data and my log curve:
The inverse of a logarithmic function is exponential, and I obtained the following reverse values, as you required:
| y |
x (Chart) |
x (Model) |
| 0 |
0 |
34.9 |
| 115 |
100 |
90.4 |
| 200 |
200 |
184.7 |
| 305 |
400 |
446.2 |
| 350 |
600 |
651.3 |
| 375 |
800 |
803.6 |
| 395 |
1000 |
950.6 |
(It uses `x=e^((y+421)//119)`.)
The values are within the ball park, but not wonderful. You could always get a better fit with more data points than I used.
Try it with better data and see how you go.
X
Hi again

OK. I think your easiest approach is to go for a logarithmic curve.

Here's my attempt with your original data and my log curve:

<img src="/forum/uploads/imf-2441-alcohol-sensor.png" width="383" height="302" alt="functions-and-graphs" />

The inverse of a logarithmic function is exponential, and I obtained the following reverse values, as you required:

<table><tr><th><i>y</i></th><th><i>x</i> (Chart)</th><th><i>x</i> (Model)</th></tr><tr><td>0</td><td>0</td><td>34.9</td></tr><tr><td>115</td><td>100</td><td>90.4</td></tr><tr><td>200</td><td>200</td><td>184.7</td></tr><tr><td>305</td><td>400</td><td>446.2</td></tr><tr><td>350</td><td>600</td><td>651.3</td></tr><tr><td>375</td><td>800</td><td>803.6</td></tr><tr><td>395</td><td>1000</td><td>950.6</td></tr></table>

(It uses `x=e^((y+421)//119)`.)

The values are within the ball park, but not wonderful. You could always get a better fit with more data points than I used.

Try it with better data and see how you go.
Re: Not getting how to calculate function equation from graph
denyera 18 Jun 2022, 09:20
It would be good if this knowledge was required by the state itself and if persons holding senior government positions were taught to study mathematics and, in necessary cases, to turn to it.
X
It would be good if this knowledge was required by the state itself and if persons holding senior government positions were taught to study mathematics and, in necessary cases, to turn to it.
You need to be logged in to reply.