How to find the equation of a quintic polynomial from its graph
By Murray Bourne, 26 Mar 2016
My earlier article on How to find the equation of a quadratic function from its graph has generated a lot of interest and many visits.
In a recent comment on that article, reader Mike asked:
"How could we go about figuring out the equation of other types of graphs?
Say I have the following quintic graph. How would I figure out the function?"
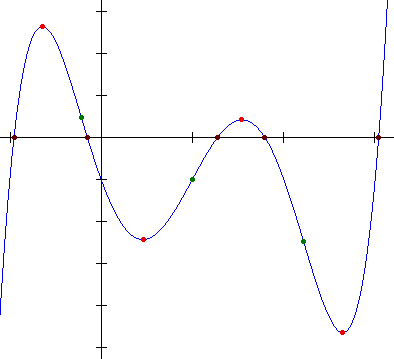
The graph has several key points marked:
- There are 5 x-intercepts (black dots)
- There are 2 local maxima and 2 local minima (red dots)
- There are 3 points of inflection (green dots)
[For some background on what these terms mean, see Curve Sketching Using Differentiation].
That should be plenty for us to find a good approximation for the equation of the function.
I'm going to assume it's a quintic (that is, a polynomial function of degree 5), not only because Mike said it was, but also the curve gets very steep at the far left and far right, suggesting it's a quintic. Of course, it is possible it has other curves beyond the domain shown, but we can only work with what we've been given.
General form of a quintic
A polynomial function of degree 5 (a quintic) has the general form:
y = px5 + qx4 + rx3 + sx2 + tx + u
We'll find the easiest value first, the constant u.
Finding the constant
From the graph we see that when x = 0, y = −1. Substituting these values in our quintic gives u = −1
So our quintic becomes:
y = px5 + qx4 + rx3 + sx2 + tx − 1
Finding the x-intercepts
Our aim is to set up a system of 5 equations with 5 unknonws.
Next, we'll substitute in the x-intercepts (where y = 0). It's too hard to estimate the places where the curve cuts the x-axis, so we construct a grid, as follows:
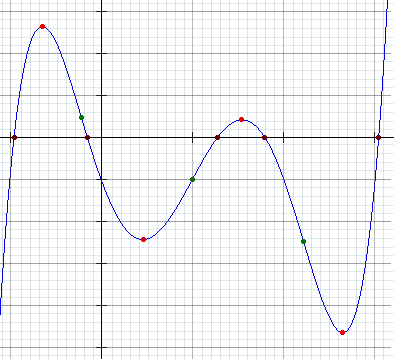
Using this grid, we can estimate where the black dots are on the x-axis:
x = −0.96, −0.15, 1.28, 1.8, 3.05
We substitute those 5 points one at a time into our general quintic equation and obtain the following 5 equations (Of course, I'm using software to do these steps):
− 0.8154p + 0.8493q − 0.8847r + 0.9216s − 0.96t − 1 = 0 ... [1]
− 0.00008p + 0.0005q − 0.003r + 0.0225s − 0.15t − 1 = 0 ... [2]
3.4360p + 2.6844q + 2.0972r +1.6384s + 1.28t − 1 = 0 ... [3]
18.8957p + 10.4976q + 5.832r + 3.24s + 1.8t − 1 = 0 ... [4]
263.9363p + 86 5365q + 28.3726r + 9.3025s + 3.05t − 1 = 0 ... [5]
Next, we solve those 5 simultaneous equations (using a computer algebra system) and obtain:
p = 0.9882235373
q = −4.960882158
r = 4.978373717
s = 5.015096102
t = −6.043658926
This means our quintic equation is approximately:
y = 0.988x5 − 4.96x4 + 4.978x3 + 5.015x2 − 6.043x − 1
(Of course, I've used full available accuracy throughout, but have rounded my answers for clarity.)
Is the equation correct?
In the earlier article about finding the equation of a quadratic curve, we learned that there are an infinite number of possibilities if we only use the x-intercepts.
However, how good is the solution we just found?
We'll check it graphically, then analytically.
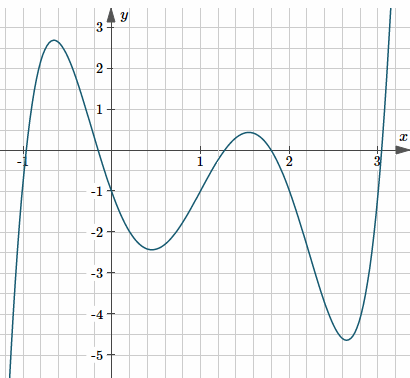
The above derived graph is certainly close to the original curve given.
Now let's analytically examine if the other key points on the graph make sense.
Local maxima and minima
The local maxima and local minima (the "tops of the hills" and "bottoms of the valleys") are found by finding the first derivative, setting it equal to 0, then solving for x.
![]()
![]()
This equals 0 when x = −0.648, 0.458, 1.551 or 2.655.
Substituting these back into the equation for the quintic gives us the two local maxima:
(−0.648, 2.680) and (1.551, 0.427),
and the two local minima:
(0.458, −2.436) and (2.655, −4.653).
A check on the graph above shows these are very close to the red dots on the curve.
Points of inflection
There are three points of infleciton shown on the graph. Let's find the points of inflection using the quintic equation I found.
We find the second derivative and set it equal to zero.
![]()
![]()
This second derivative equals zero when x = −0.226, 1.004, or 2.234.
Substituting these back into the equation for the quintic gives the points of inflection:
(−0.226, 0.552), (1.004, −1.005) and (2.234, −2.540).
These are very close to the green dots on the curve.
So we can be confident we have a very good approximation for the equation of the quintic.
The original equation
The astute amongst you would have noticed the equation I obtained is actually very close to the following equation with integer values for the coefficients:
y = x5 − 5x4 + 5x3 + 5x2 − 6x − 1
In fact, this was the original curve, as given in the page from where the graph came.
See the 7 Comments below.