IntMath Newsletter: Graph plotter, visual math
By Murray Bourne, 07 Jun 2011
7 Jun 2011
In this Newsletter:
1. Summer math brain drain
2. Resource - Graph plotter using JSXGraph
3. Poll results and new poll
4. Visual design for math teachers
5. Friday math movies
6. Resource - Teachers’ Domain
7. Final thought – ambitions
Please share the love
Please use the Twitter, Facebook and LinkedIn buttons on any page of IntMath.com to tell your friends about IntMath!
1. Summer math brain drain
It's summer holidays in the northern hemisphere and sadly, many students get as far away from math as possible. This is a shame because their grade level drops significantly as a result - and math is even harder when school starts again. "Use it or lose it" is certainly relevant here.
Here are some thoughts on this issue, from the archive:
Math of the Great Summer Brain Drain
2. Resource - Graph plotter using JSXGraph
 |
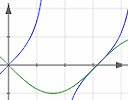
This is a handy and user-friendly graph plotter which works in all major browsers and operating systems - even on smartphones! |
3. Poll results and new poll
Thanks to all who voted in the poll about stress. Here are the results.
Which of these stresses you the most?
Doing exams: 41%
Homework: 24%
Relationships: 18%
Being bullied: 9%
Teachers: 7%
Total votes: 3600
As the poll was conducted during exam time (for those in the northern hemisphere), it's not surprising "doing exams" was at the top. It's encouraging for teachers that they cause least stress out of this list!
Current poll: Your favorite subject?
There's a new poll which asks about your favorite subject at school. Vote on any page in IntMath.com.
4. Visual design for math teachers
Suitable for: Teachers, but worthwhile for all of you. It's important to think about how to improve visual communication, especially when it comes to statistics.
This is an important 21st century skill.
 |
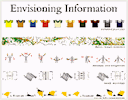
Diagrams should make things easier to understand, but often they don't. How can we fix this? |
5. Friday math movies
Suitable for: Everyone
(a) Artfully visualizing our humanity
 |
This video is a great treatment of math for multiple intelligences - visual, musical and interpersonal. |
(b) Bach Crab Canon
 |
Here's a very neat way to illustrate Bach's Crab Canon - using a Mobius strip. |
(c) World Metrology Day 2011
 |
This video commemorates World Metrology Day, which was held on 20th May. Go metric and make your lives simpler! |
6. Resource - Teachers’ Domain
Suitable for: Teachers
 |
This is a place where teachers can download, share and save resources. Free registration. |
7. Final thought – ambitions
Math anxiety is often the result of criticism by peers. Here is some good advice for such situations from Mark Twain.
Keep away from people who try to belittle your ambitions. Small people always do that, but the really great make you feel that you, too, can become great. [Mark Twain]
Until next time, enjoy whatever you learn.
See the 2 Comments below.
