Hyperinflation
By Murray Bourne, 28 Aug 2008
The last time that worldwide inflation was high (over 10%) was in the 1970s (as a result of the first oil shock) and into the 1980s (once inflation kicks up, it is hard to kill it). Since then inflation has been quite low - around 3% in most of the major economies.
In 2007 the first rumblings of higher inflation were felt as China’s and India’s unstoppable growth added to the cost of food, oil and building materials around the world.
Inflation is now above 5% in many countries. For example, Vietnam's inflation of 27.5% is the worst case in Asia currently.
What is Inflation?
The effect of inflation is to reduce the value of your money by a certain percentage amount each year.
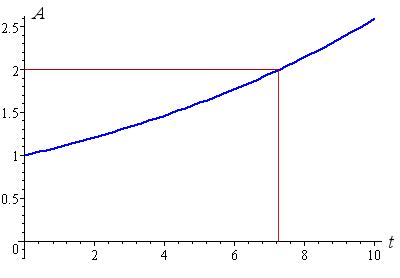
So for example, if we can buy an ice cream for $1 today and inflation is 10%, we will need $1.10 in one year from now to buy the same ice cream. After about 7 years, you need $2 to buy that ice cream. In other words, the value of your money has halved. The amount (A) of money needed after time t is given by the equation:
A = (1 + 0.10)t
The following graph shows the 10% inflation case, where the blue curve shows the amount of money we will need to buy our ice cream over a 10-year period. The red line indicates how long it takes for our money to halve in value (just over 7 years).
In general, if we need P dollars to buy something now, and inflation is running at r%, then the amount of money we will need to buy the item at time t is given by
A = P(1 + r)t
The resulting curve is an example of exponential growth. This is growth that starts slowly but then its rate of growth increases over time. Other examples of exponential growth are the interest you earn in a bank account and population growth. See more at Exponential and Logarithmic Functions.
100% Inflation
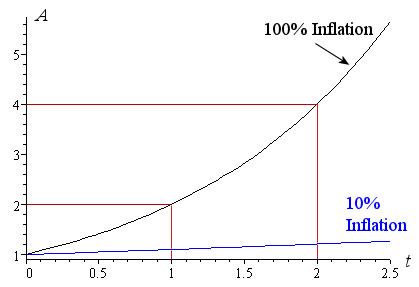
Now, what if inflation is 100%? This means that it only takes one year for our money to halve in value. In this case we have:
A = (1 + 1)t = 2t
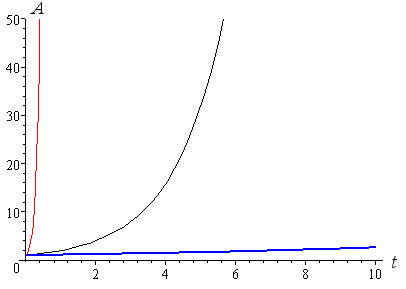
In the graph below, the black curve represents 100% inflation. We can see that after 1 year, the cost of our ice cream is $2, and after 2 years, we need to pay $4. The blue curve shows 10% inflation for comparison.
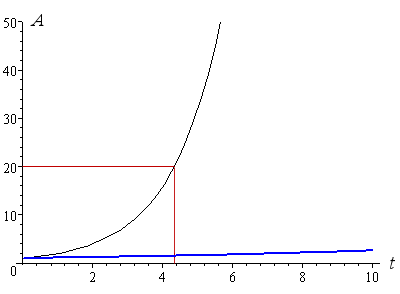
Now let's zoom out and see what happens during a 10-year period for the 10% and 100% inflation cases. We can see that after just over 4 years, we would need $20 to buy that ice cream. After 6 years we need more than $50!
We use the term hyperinflation once prices get out of control like this. Let’s get an idea of what such hyperinflation is like.
Hyperinflation Effects
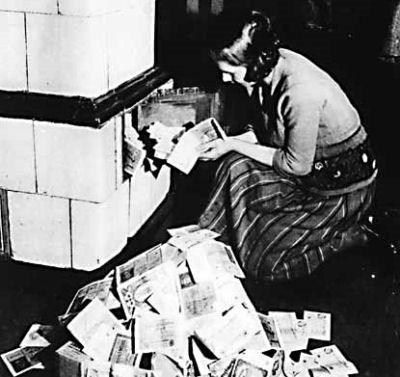
In Germany, hyperinflation hit during the 1920s. At one stage, things were so bad that they needed to print a 100 trillion (1020) Deutsche Mark note. Prices rose by 50% per day and employees were paid twice a day. They spent their lunch and dinner times carting off their salary (often in wheelbarrows) and they bought anything they could.
The money became so worthless that it was cheaper to burn the notes for heating than it was to buy firewood. Here's a German woman stuffing her fireplace with worthless paper money in 1923. (Image source: Wikipedia)
After World War II, Hungary had hyperinflation and shop prices doubled every 15 hours!
Zimbabwe's Hyperinflation - Now
But spare a thought for Zimbabwe, where government incompetence has led to inflation currently sitting at 2.2 million percent! The value of their money is plunging and they have to keep on adding zeros to the banknotes just to keep up. Eventually, there were too many zeros and it became totally impractical. The Zimbabwe government just introduced a new note that shaved 10 zeros off the currency. The old 10 billion Zimbabwe dollar has become just Z$1.
To represent 2.2 million per cent inflation, I need to plot the curve:
A = (1 + 22000)t
We can see from the red curve that with inflation at 2.2 million percent, $50 for the ice cream is reached in no time at all. After 1 year, we need $22001.
Let's change the vertical scale to see the amount needed to buy something. Now, the 10% and 100% inflation cases appear flat and we see that the red inflation curve for Zimbabwe shows that we need $1 million dollars for an ice cream sometime early in the 2nd year. At the end of the 2nd year, it will be $484 million.
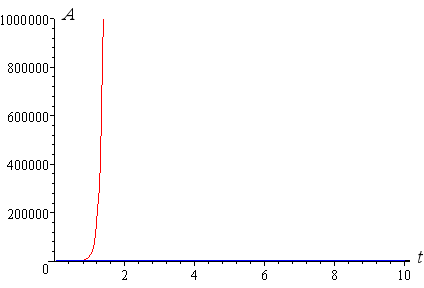
We can see that there is some difficulty representing this information on these graphs. The 10% and 100% inflation cases have disappeared and the Zimbabwe case runs off the top of the graph before the 2 year point.
Semi-log Graph of Zimbabwe's Hyperinflation
If we use a logarithmic scale on the vertical axis, we are able to see the information much more easily.
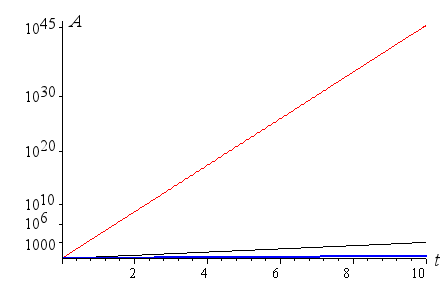
Now each curve appears as a straight line and we can more easily see the relative effects of 10%, 100% and 2.2 million % inflation.
See more on semi-log and log graphs.
Why is all this Important?
When economies get out of control, there is usually civil unrest and this can lead to war. Germany's hyperinflation of the 1920s destroyed the lives of the middle classes and so they were more likely to join the Nazi Party, since it was the only thing that seemed to give them some hope.
And today, Zimbabwe's many problems are being made even worse by hyperinflation. I wish them well.
See the 4 Comments below.
1 Sep 2008 at 8:51 pm [Comment permalink]
Interesting article, thanks.
Wow - 2.2 million percent inflation must be really weird. And I thought 5% inflation was bad.
1 Sep 2008 at 9:59 pm [Comment permalink]
i cant expressed in words, how much i like this news article...
really this was very wonderful i like it....
thanks for giving such type of information...
plz provide some more information....
21 Mar 2009 at 10:27 am [Comment permalink]
I'm concerned about what things look like after the hyperinflation is over. Say I have $1000 in a cd earning 10% during hyperinflation. What does it look like 3 years later after HI is resolved?
22 Mar 2009 at 8:55 pm [Comment permalink]
Hi Jerry
The short answer is, your $1000 will look quite sick. In these circumstances, people don't save, they run around and buy things before the prices go up. Any money in the bank loses value so fast it's not worth keeping.
Let's hope the massive stimulus packages being thrown at the world's economies do not lead us to hyperinflation.