Autograph 2-D and 3-D graph plotter: a review
By Murray Bourne, 23 Jan 2012
Autograph is a 2-D and 3-D graphing application by Douglas Butler of Oundle School in the UK.
Autograph claims to be a "3rd generation graph plotter for schools and colleges". It's clear as soon as you start using Autograph it's been designed by a math educator, for the purpose of math education.
A teacher can produce objects that students can explore, but even better, it is simple enough to use so students can create their own graphs. This is an essential requirement for such software.
At first glance, Autograph shares features with two other applications I've used:
- GeoGebra, a free community based offering, which is strong on geometry but lacks 3-D support (although this is under development for version 5). GeoGebra is available for PC, Mac and Linux, since it is Java-basesd, but it won't work on tablets; and
- Livemath, a commercial offering which is no longer under development. Livemath has algebra features (e.g. factoring, solving equations, matrix operations and calculus) that Autograph and GeoGebra don't. Both Livemath and Autograph provide a Web page embed option, so you can view the graph and interact with it using a free plugin, without having to install the full application. Available for PC, Mac and Linux, but not tablets.
However, Autograph is still worth a look becuase it is a user-friendly, integrated package. (It's around US$100 for a single user license.)
It's available for PC and Mac, but like the other 2 products, it won't work on iPad or other tablets.
For this article, I attempted to do similar things I did earlier in my GeoGebra review article, to see how well Autograph performed in comparison.
Disclaimer: The developers of Autograph sent me a review copy, but this is otherwise an independent review.
2-D graphs
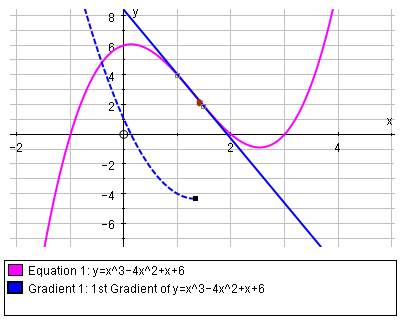
You can enter your equation in familiar y = f(x) form, and Autograph will plot it with a minimum of fuss.
In this first example, I've plotted a cubic curve (in magenta) and a tangent to the curve. There's also the derivative curve (the blue dotted parabolic curve).
You can also easily animate each plot, by clicking on the turtle icon:
![]()
This is useful for making things more dynamic (a point moves along the x-axis, while the graph is traced out at the same time), and for helping students understand how a particular graph "works".
Geometry
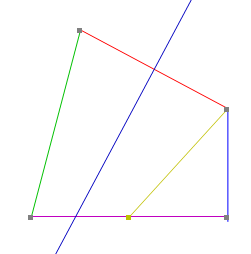
Like GeoGebra, Autograph allows you to draw lines between 2 points (and triangles, rectangles, etc), find mid-points, perpendicular lines, intersections between lines, and so on:
With 3 points selected, you can right click to get the following options.
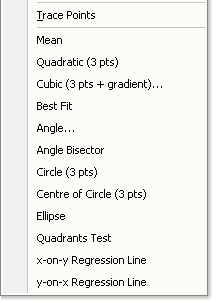
There are similar options (and the context menu changes appropriately) for 2, 4, or more points.
Statistics, too
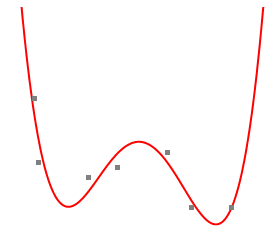
Apart from histograms, scatter diagrams and binomial distributions, the statistics options allow you to create best fit curves, like this one through 7 data points:
3-D plots
3-D plots is one area where Autograph is a stronger product than GeoGebra. Geogebra does not have native 3-D graph support (athough they are working on this for version 5 of GeoGebra as mentioned before).
It was very easy to produce the following conic section plot in Autograph, following along with their video tutorial. You can include several "variable constants" when creating your plot, and then change the value of the constants while exploring the resulting curve.
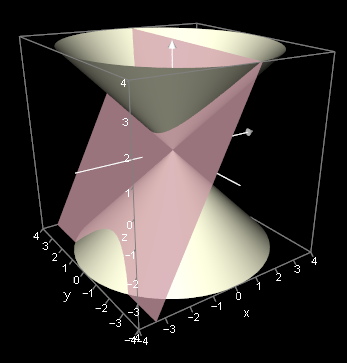
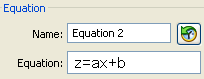
The pinkish plane in the plot was graphed using z = ax + b. You can then change the value of a or b to move the plane around (and thus see the various conic sections).
You then use the "Constant Controller" to vary the values of the constants.
You can animate the changing values and see the effect on the graph. This feature is also available in Livemath.
Calculus
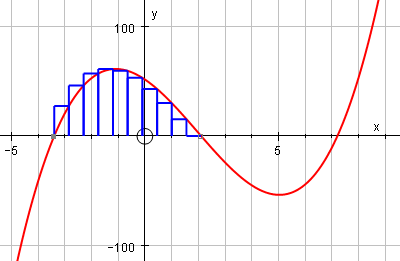
You can use Riemann Sums (using either rectangles, trapezoids or Simpson's Rule) to approximate the area under a curve:
You can also draw an integral function from a given function (you click on the graph to provide an initial value (the point through which the integral curve passes).
Volume of Solid of Revolution
It was easy to set up a demonstration of volume of solid of revolution, especially when following the provided tutorial.
Modelling a Human Cannonball
This example is from their video tutorial page and shows what can be achieved when modelling using Autograph.
THe problem: A person gets shot out of the end of a cannon. What is the trajectory?
You can model the trajectory and modify parameters until your model lines up with the image, like this:
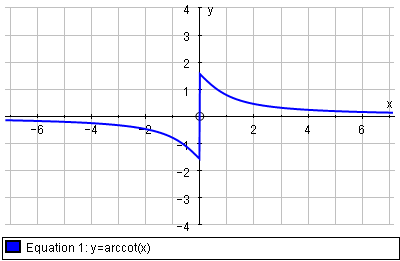
The dreaded y = arccot(x) function
This has become a standard test for me when exploring new graphing software. Different math software designers use 2 different possible graphs for y = arccot(x). See Which is the correct graph of y = arccot(x)?
Autograph produces the "second" interpretation, which assumes an original domain of −π/2 to π/2:
Output formats
You can output Autograph files as either:
- A BMP or WMF image of the graph
- A copy of the equations used
- A copy of the status bar (for areas, and other output values)
- An HTML page
Th HTML output option is interesting. The file sizes are nice and small (9 kB for the proprietary .AGG Autograph file, and 8 kB for the HTML file) and so it loads quickly. It even works in Internet Explorer!
The minus point about the HMTL output is the user needs to download the Autograph plugin, and there is always resistance (and confusion) associated with this process.
Example HTML output: Here is one of the Autograph files in HTML output:
Riemann Sum - Autograph file (this required a plugin which is not supported by most browsers)
You can interact with this graph by moving it around, selecting parts of it, sketching on top of it, and so on.
In many ways the Autograph HTML output is better than GeoGebra's huge and slow-loading Java files.
Gripe: unexplained levels
Most people don't dig into manuals when using new software (well, I certainly don't) - they just play with it and see what it can do.
The first time you open Autograph, you are given this dialog box:
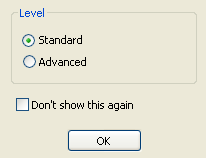
There is no explanation on the radio buttons about what these levels mean or the implications of choosing one over the other.
So I happily started using the product (having accepted the default value of "Standard"), and found it quite limited. I couldn't even change from degrees (the default) to radians (which I almost exclusively use these days).
Some graphs didn't seem to plot properly and I was getting pretty frustrated.
After digging around in the documentation, I found out what "Standard" and "Advanced" level were for (the former gives a simpler subset of tools for newbies, the latter gives you full options).
There's nothing wrong with that as a design approach, but it should be explained in that very first dialog box! A simple list of features you'll get if you choose "Advanced" would have made a lot of difference to my first 30 minutes using the product.
Video tutorials
The short videos on the following page show you some of the capabilities of Autograph, and how to achieve them:
Conclusion
Autograph is a respectable graphing package which is designed by educators for educational use.
The 2 modes ("advanced" and "basic") allow beginners to explore 2-D graphs with few complications, while the "advanced" option gives you many more ("grown up") things to play with.
This package is suitable for grade 6 to early college level math course.
The price point is probably on the high side, especially considering GeoGebra's upcoming 3-D developments, but Autograph is certainly worth checking out.
See the 3 Comments below.
14 Nov 2012 at 9:55 am [Comment permalink]
It was very interesting, as I learn it. And I tried to use Adobe Flash.
15 Jan 2016 at 6:16 pm [Comment permalink]
Hi, very nice article. Can you recommand also a software for visualizing 3-variable functions like f=x² + y² +z² +x*y???
16 Jan 2016 at 8:14 am [Comment permalink]
@Stephan: You need to think of such a function using level surfaces.
It can be done with Autograph.