Math of air pollution
By Murray Bourne, 28 Jun 2013
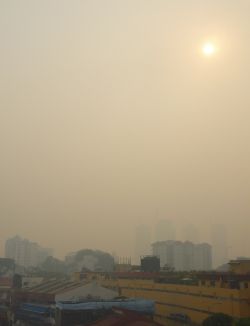
Smoke haze enshrouds Singapore
As I write this, my adopted city of Singapore is shrouded in a dangerous smoke haze.
From June to September each year, during the south west monsoon, much of Southeast Asia is hot and dry (unlike the northeast monsoon which brings wet weather).
Traditionally, the dry season was the time when Indonesian farmers would use slash and burn techniques to clear rainforest to produce farming land. Farmers still do that, even though it is now illegal.
But the bigger problem is the palm oil producers. Palm oil is used in many products, including baked goods, confectionery, cosmetics and cleaning agents.
Huge swathes of old growth rainforest are cleared each year for the monoculture palm oil plantations, causing immeasurable environmental harm, not only directly for the people afected by the toxic smoke haze, but also for the loss of biodiversity and increase in CO2 in the atmosphere.
On Friday 21 Jun, the 3-hour Pollution Standards Index (PSI) in Singapore hit a record high of 401, well into the "Hazadous" range as identified by the United States Environmental Protection Agency.
Where does this PSI figure come from?
PSI calculation
The Pollution Standards Index is based on standards set by the US Environment Protection Agency. The index is a number representing the the highest concentration of 5 common pollutants averaged over a 24-hour period.
The National Environment Agency monitors the following 5 pollutants:
- Particulate matter (PM10, that is small particles with an "aerodynamic" diameter smaller than 10 µm);
- Sulphur dioxide (SO2);
- Carbon monoxide (CO);
- Ozone (O3); and
- Nitrogen dioxide (NO2)
According to the WHO, particulate matter (PM) is the one we should worry about most:
PM affects more people than any other pollutant. The major components of PM are sulfate, nitrates, ammonia, sodium chloride, carbon, mineral dust and water. It consists of a complex mixture of solid and liquid particles of organic and inorganic substances suspended in the air.
The guideline value for "healthy" air is a maximum 24-hour mean value of 50 μg/m3 for PM10.
The smaller PM2.5 particles (or those with an aerodynamic diameter smaller than 2.5 µm), ...
... are more dangerous since, when inhaled, they may reach the peripheral regions of the bronchioles, and interfere with gas exchange inside the lungs. [Source]
Any amount of particulate matter should be avoided, since it can lead to lung infections and lung cancers.
The term "aerodynamic diameter" is used because these small toxic particles have irregular shapes, and so their behavior is expressed in terms of an idealized spherical particle with the comparable aerodynamic properties. (A particle with flat sides will have a larger aerodynamic diameter than a cigar-shaped one of roughly similar size, because the flat-sided one has worse aerodynamics.)
Calculation of the PSI
Singapore's National Environment Agency provides some information on the Computation of PSI (PDF).
Let's look at the PM10 case, as that is the predominant pollutant during haze periods caused by forest fires.
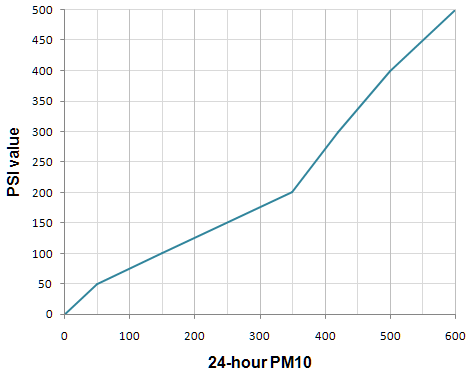
Here are the values given in the table in the NEA article for various PM10 readings and their corresponding PSI value.
| 24-hr PM10 (μg/m3) |
PSI value |
|---|---|
| 50 | 50 |
| 150 | 100 |
| 350 | 200 |
| 420 | 300 |
| 500 | 400 |
| 600 | 500 |
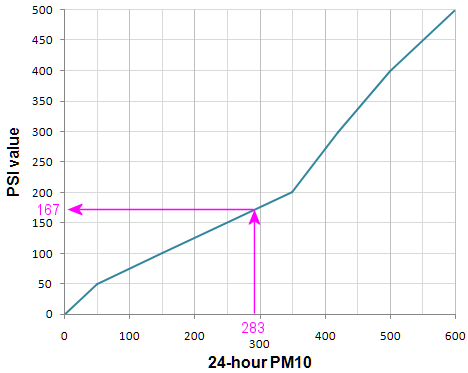
As we observe in the following graph, the PM10 concentrations are not in an exact linear relationship with the PSI number. There are several linear segments. (Actually, the second row of the table is redundant.)
According to the PDF, the sub-index for a particular pollutant is calculated as follows:
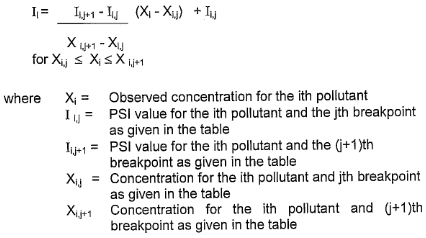
This just means they are using linear interpolation for each linear segment. (See more on linear interpolation)
Example
Let's look closer at the example they give in the short article. Consider the case where the 24-hour average of PM10 pollution is found to be 283 μg/m3.
The NEA perform the following linear interpolation step to get the PSI sub-index number.
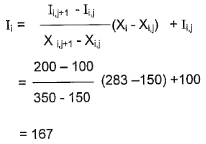
If you are not sure what is going on here, this is equivalent to finding the equation of the line through the endpoints of the segment, which in this case are (150, 100) and (350, 200), and then substituting in the given value of 283.
To find the equation of the line segment, we use the formula:
![]()
We use x1 = 150 and y1 = 100, and work out the slope m as:
![]()
After some algebra, this gives us the line through the given points:
![]()
Substituting the given value x = 283 gives us:
y = 167.
Graphical approach
It's even easier to see what is going on in a graph. Here is what the above 2 processes are doing for us. We have an observed value 283, and we read off the graph the answer of 167.
Maximum of 5 pollutants
The above is done for each of the 5 pollutants measured (with their own respective linear segments), and the maximum of the 5 sub-indices is taken as the PSI for that period.
Why linear segments?
The PSI is really an attempt to provide a number that can be used for health advisories, such as the following:
| PSI Value | Air Quality Descriptor |
|---|---|
| 0 - 50 | Good |
| 51 - 100 | Moderate |
| 101 - 200 | Unhealthy |
| 201 - 300 | Very unhealthy |
| Above 300 | Hazardous |
Different pollutants have different health effects at different concentrations. So if the pollutant with the highest concentration is Ozone, we need to know how the health effects compare to that of NO2, for example.
The linear segments used for each of the 5 pollutants is an attempt to equate the health effects of the pollutants.
3-hour PSI?
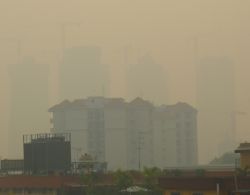
Haze almost obliterates buildings 300 m away
During the 1997 haze period, Singaporeans were confused by "24-hour PSI" readings that didn't seem to correlate with observed visual pollution. The 24-hour reading is used throughout the world since health risks increase with prolonged exposure.
Notwithstanding, Singapore's NEA began to publish 3-hour readings (and now they are at pains to convince people that they should only concern themselves with the longer time period index, since that is what the health advisories are based on).
Other Pollution Indices
See Air Quality Index for information about the similar, but slightly different air pollution indices used around the world.
See the 4 Comments below.