13. The Poisson Probability Distribution
On this page...
The Poisson Distribution was developed by the French mathematician Simeon Denis Poisson in 1837.
The Poisson random variable satisfies the following conditions:
The number of successes in two disjoint time intervals is independent.
The probability of a success during a small time interval is proportional to the entire length of the time interval.
Apart from disjoint time intervals, the Poisson random variable also applies to disjoint regions of space.
Applications
- the number of deaths by horse kicking in the Prussian army (first application)
- birth defects and genetic mutations
- rare diseases (like Leukemia, but not AIDS because it is infectious and so not independent) - especially in legal cases
- car accidents
- traffic flow and ideal gap distance
- number of typing errors on a page
- hairs found in McDonald's hamburgers
- spread of an endangered animal in Africa
- failure of a machine in one month
Notation
We use upper case variables (like X and Z) to denote random variables, and lower-case letters (like x and z) to denote specific values of those variables.
The probability distribution of a Poisson random variable X representing the number of successes occurring in a given time interval or a specified region of space is given by the formula:
`P(X)=(e^{-mu} mu^x)/(x!)`
where
`x = 0, 1, 2, 3...`
`e = 2.71828` (but use your calculator's e button)
`μ =` mean number of successes in the given time interval or region of space
Mean and Variance of Poisson Distribution
If μ is the average number of successes occurring in a given time interval or region in the Poisson distribution, then the mean and the variance of the Poisson distribution are both equal to μ.
E(X) = μ
and
V(X) = σ2 = μ
Note: In a Poisson distribution, only one parameter, μ is needed to determine the probability of an event.
Example 1
A life insurance salesman sells on the average `3` life insurance policies per week. Use Poisson's law to calculate the probability that in a given week he will sell
Some policies
-
`2` or more policies but less than `5` policies.
-
Assuming that there are `5` working days per week, what is the probability that in a given day he will sell one policy?
Answer
Here, μ = 3
(a) "Some policies" means "1 or more policies". We can work this out by finding 1 minus the "zero policies" probability:
P(X > 0) = 1 − P(x0)
Now `P(X)=(e^(-mu)mu^x)/(x!)` so `P(x_0)=(e^-3 3^0)/(0!)=4.9787xx10^-2`
Therefore the probability of `1` or more policies is given by:
`"Probability"=P(X>=0)`
`=1-P(x_0)`
`=1-4.9787xx10^-2`
`=0.95021`
(b) The probability of selling 2 or more, but less than 5 policies is:
`P(2<=X<5)`
`=P(x_2)+P(x_3)+P(x_4)`
`=(e^-3 3^2)/(2!)+(e^-3 3^3)/(3!)+(e^-3 3^4)/(4!)`
`=0.61611`
(c) Average number of policies sold per day: `3/5=0.6`
So on a given day, `P(X)=(e^-0.6(0.6)^1)/(1!)=0.32929`
Example 2
Twenty sheets of aluminum alloy were examined for surface flaws. The frequency of the number of sheets with a given number of flaws per sheet was as follows:
| Number of flaws | Frequency |
|---|---|
| `0` | `4` |
| `1` | `3` |
| `2` | `5` |
| `3` | `2` |
| `4` | `4` |
| `5` | `1` |
| `6` | `1` |
What is the probability of finding a sheet chosen at random which contains 3 or more surface flaws?
Answer
The total number of flaws is given by:
`(0 × 4) + (1 × 3)` `+ (2 × 5) + (3 × 2)` `+ (4 × 4) + (5 × 1)` `+ (6 × 1)` `= 46`
So the average number of flaws for the 20 sheets is given by:
`mu=46/20=2.3`
The required probability is:
`"Probability"=P(X>=3)`
`=1-(P(x_0)+P(x_1)+P(x_2))`
`=1-((e^-2.3 2.3^0)/(0!)+(e^-2.3 2.3^1)/(1!)+(e^-2.3 2.3^2)/(2!))`
`=0.40396`
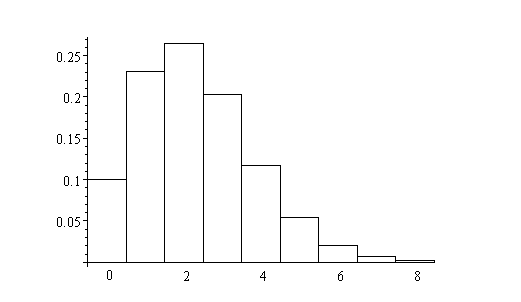
Histogram of Probabilities
We can see the predicted probabilities for each of "No flaws", "`1` flaw", "`2` flaws", etc on this histogram.
The histogram was obtained by graphing the following function for integer values of x only.
`(e^-2.3 2.3^x)/(x!)`
Example 3
If electricity power failures occur according to a Poisson distribution with an average of `3` failures every twenty weeks, calculate the probability that there will not be more than one failure during a particular week.
Answer
The average number of failures per week is: `mu=3/20=0.15`
"Not more than one failure" means we need to include the probabilities for "`0` failures" plus "`1` failure".
`P(x_0)+P(x_1)` `=(e^-0.15 0.15^0)/(0!)+(e^-0.15 0.15^1)/(1!)` `=0.98981`
Example 4
Vehicles pass through a junction on a busy road at an average rate of `300` per hour.
-
Find the probability that none passes in a given minute.
-
What is the expected number passing in two minutes?
-
Find the probability that this expected number actually pass through in a given two-minute period.
Answer
The average number of cars per minute is: `mu=300/60=5`
(a) `P(x_0)=(e^-5 5^0)/(0!)=6.7379xx10^-3`
(b) Expected number each 2 minutes = E(X) = 5 × 2 = 10
(c) Now, with μ = 10, we have: `P(x_10)=(e^-10 10^10)/(10!)=0.12511`
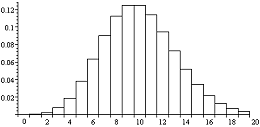
Histogram of Probabilities
Based on the function
`P(X)=(e^-10 10^x)/(x!)`
we can plot a histogram of the probabilities for the number of cars for each 2 minute period:
Example 5
A company makes electric motors. The probability an electric motor is defective is `0.01`. What is the probability that a sample of `300` electric motors will contain exactly `5` defective motors?
Answer
The average number of defectives in 300 motors is μ = 0.01 × 300 = 3
The probability of getting `5` defectives is:
`P(X)=(e^-3 3^5)/(5!)=0.10082`
NOTE: This problem looks similar to a binomial distribution problem, that we met in the last section.
If we do it using binomial, with `n = 300`, `x = 5`, `p = 0.01` and `q = 0.99`, we get:
P(X = 5) = C(300,5)(0.01)5(0.99)295 = 0.10099
We see that the result is very similar. We can use binomial distribution to approximate Poisson distribution (and vice-versa) under certain circumstances.