12. The Binomial Probability Distribution
Later, on this page...
Notation
We use upper case variables (like X and Z) to denote random variables, and lower-case letters (like x and z) to denote specific values of those variables.
A binomial experiment is one that possesses the following properties:
The experiment consists of n repeated trials;
Each trial results in an outcome that may be classified as a success or a failure (hence the name, binomial);
The probability of a success, denoted by p, remains constant from trial to trial and repeated trials are independent.
The number of successes X in n trials of a binomial experiment is called a binomial random variable.
The probability distribution of the random variable X is called a binomial distribution, and is given by the formula:
`P(X)=C_x^n p^x q^(n-x)`
where
n = the number of trials
x = 0, 1, 2, ... n
p = the probability of success in a single trial
q = the probability of failure in a single trial
(i.e. q = 1 − p)
`C_x^n` is a combination
P(X) gives the probability of successes in n binomial trials.
Mean and Variance of Binomial Distribution
If p is the probability of success and q is the probability of failure in a binomial trial, then the expected number of successes in n trials (i.e. the mean value of the binomial distribution) is
E(X) = μ = np
The variance of the binomial distribution is
V(X) = σ2 = npq
Note: In a binomial distribution, only 2 parameters, namely n and p, are needed to determine the probability.
Example 1

A die is tossed `3` times. What is the probability of
(a) No fives turning up?
(b) `1` five?
(c) `3` fives?
Answer
This is a binomial distribution because there are only `2` possible outcomes (we get a `5` or we don't).
Now, `n = 3` for each part. Let `X =` number of fives appearing.
(a) Here, x = 0.
`P(X=0)` `=C_x^np^xq^[n-x]` `=C_0^3 (1/6)^0 (5/6)^3` `=125/216` `=0.5787 `
(b) Here, x = 1.
`P(X=1)` `=C_x^np^xq^[n-x]` `=C_1^3 (1/6)^1 (5/6)^2` `=75/216` `=0.34722 `
(c) Here, x = 3.
`P(X=3)=C_x^np^xq^[n-x]` `=C_3^3 (1/6)^3 (5/6)^0` `=1/216` `=4.6296times10^-3 `
Example 2
Hospital records show that of patients suffering from a certain disease, `75%` die of it. What is the probability that of `6` randomly selected patients, `4` will recover?
Answer
This is a binomial distribution because there are only 2 outcomes (the patient dies, or does not).
Let X = number who recover.
Here, `n = 6` and `x = 4`. Let `p = 0.25` (success, that is, they live), `q = 0.75` (failure, i.e. they die).
The probability that `4` will recover:
`P(X)` `= C_x^np^xq^[n-x]` `=C_4^6(0.25)^4(0.75)^2` `=15times 2.1973 times 10^-3` `=0.0329595 `
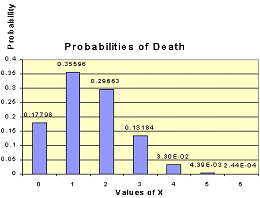
Histogram of this distribution:
We could calculate all the probabilities involved and we would get:
| `X` | `text[Probability]` |
| `0` | `0.17798` |
| `1` | `0.35596` |
| `2` | `0.29663` |
| `3` | `0.13184` |
| `4` | `3.2959 times 10^-2` |
| `5` | `4.3945times10^-3` |
| `6` | `2.4414times10^-4` |
The histogram is as follows:
It means that out of the `6` patients chosen, the probability that:
- None of them will recover is `0.17798`,
- One will recover is `0.35596`, and
- All `6` will recover is extremely small.
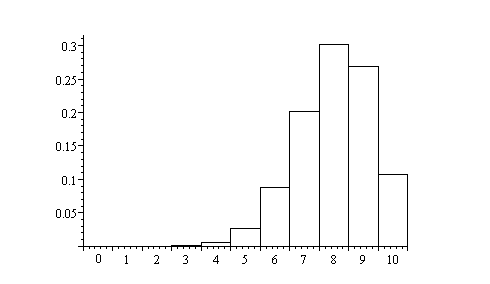
Example 3

In the old days, there was a probability of `0.8` of success in any attempt to make a telephone call. (This often depended on the importance of the person making the call, or the operator's curiosity!)
Calculate the probability of having `7` successes in `10` attempts.
Answer
Probability of success `p = 0.8`, so `q = 0.2`.
`X =` success in getting through.
Probability of `7` successes in `10` attempts:
`text[Probability]=P(X=7)`
`=C_7^10(0.8)^7(0.2)^[10-7]`
`=0.20133`
Histogram
We use the following function
`C(10,x)(0.8)^x(0.2)^[10-x]`
to obtain the probability histogram:
Example 4
A (blindfolded) marksman finds that on the average he hits the target `4` times out of `5`. If he fires `4` shots, what is the probability of
(a) more than `2` hits?
(b) at least `3` misses?
Answer
Here, `n = 4`, `p = 0.8`, `q = 0.2`.
Let `X =` number of hits.
Let x0 = no hits, x1 `= 1` hit, x2 `= 2` hits, etc.
(a) `P(X)=P(x_3)+P(x_4)`
`=C_3^4(0.8)^3(0.2)^1+` `C_4^4(0.8)^4(0.2)^0`
`=4(0.8)^3(0.2)+(0.8)^4`
`=0.8192`
(b) `3` misses means `1` hit, and `4` misses means `0` hits.
`P(X)=P(x_1)+P(x_0)`
`=C_1^4(0.8)^1(0.2)^3+` `C_0^4(0.8)^0(0.2)^4`
`=4(0.8)^1(0.2)^3+(0.2)^4`
`=0.0272`
Example 5

The ratio of boys to girls at birth in Singapore is quite high at `1.09:1`.
What proportion of Singapore families with exactly 6 children will have at least `3` boys? (Ignore the probability of multiple births.)
[Interesting and disturbing trivia: In most countries the ratio of boys to girls is about `1.04:1`, but in China it is `1.15:1`.]
Answer
The probability of getting a boy is `1.09/(1.09+1.00)=0.5215`
Let `X =` number of boys in the family.
Here,
`n = 6`,
`p = 0.5215`,
`q = 1 − 0.52153 = 0.4785`
When `x=3`:
` P(X)` `=C_x^np^xq^(n-x)` `=C_3^6(0.5215)^3(0.4785)^3` `=0.31077`
When `x=4`:
` P(X)` `=C_4^6(0.5215)^4(0.4785)^2` `=0.25402`
When `x=5`:
`P(X)` `=C_5^6(0.5215)^5(0.4785)^1` `=0.11074`
When `x=6`:
`P(X)` `=C_6^6(0.5215)^6(0.4785)^0` `=2.0115xx10^-2`
So the probability of getting at least 3 boys is:
`"Probability"=P(X>=3)`
`=0.31077+0.25402+` `0.11074+` `2.0115xx10^-2`
`=0.69565`
NOTE: We could have calculated it like this:
`P(X>=3)` `=1-(P(x_0)+P(x_1)+P(x_2))`
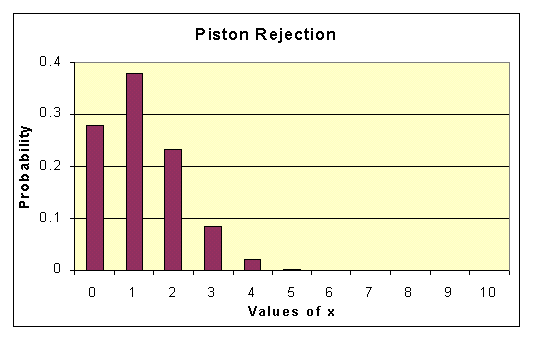
Example 6
A manufacturer of metal pistons finds that on the average, `12%` of his pistons are rejected because they are either oversize or undersize. What is the probability that a batch of `10` pistons will contain
(a) no more than `2` rejects? (b) at least `2` rejects?
Answer
Let `X =` number of rejected pistons
(In this case, "success" means rejection!)
Here, `n = 10`, `p = 0.12`, `q = 0.88`.
(a)
No rejects. That is, when `x=0`:
`P(X)` `=C_x^np^xq^(n-x)` `=C_0^10(0.12)^0(0.88)^10` `=0.2785`
One reject. That is, when `x=1`
`P(X)` `=C_1^10(0.12)^1(0.88)^9` `=0.37977`
Two rejects. That is, when `x=2`:
`P(X)` `=C_2^10(0.12)^2(0.88)^8` `=0.23304`
So the probability of getting no more than 2 rejects is:
`"Probability"=P(X<=2)`
`=0.2785+` `0.37977+` `0.23304`
`=0.89131`
(b) We could work out all the cases for `X = 2, 3, 4, ..., 10`, but it is much easier to proceed as follows:
`"Probablity of at least 2 rejects"`
`=1-P(X<=1)`
` =1-(P(x_0)+P(x_1))`
` =1-(0.2785+0.37977)`
`=0.34173`
Histogram
Using the function `g(x)=C(10,x)(0.12)^x(0.88)^(10-x)` and finding the values at `0, 1, 2, ...`, gives us the histogram: